Free tools Windows power users keep installed
One-click scans. No signup required.
FPS drops from 160 to 20 every 15 seconds in every game are usually not a single-game graphics-settings problem. When the desktop or browsing also slows down, capture system telemetry at the exact moment of the drop and investigate background processes, disk activity, paging, drivers, temperatures, clock speeds, power, and hardware stability. The historical thread behind this title was marked solved, but the available discussion does not identify the original poster’s verified final fix.
Short answer: an FPS collapse from about 160 to 20 every 15 seconds, happening in every game and even during ordinary web browsing, is unlikely to be a problem with one game’s graphics settings. It is more consistent with an intermittent system-wide event: a background process, disk or paging activity, driver or Windows interruption, thermal or power behavior, or unstable hardware.
The historical forum case behind this title was marked “Solved,” but the available discussion does not include a final statement from the original poster identifying what actually fixed the computer. The marked reply recommended finding the process or resource spike in Task Manager; it did not prove that malware, Windows indexing, overheating, the graphics card, or any other single cause was responsible.
What was reported in the original case?
The thread was opened on July 18, 2019. The reported pattern was:
Outdated Drivers Are Slowing You Down
One free scan finds every outdated or missing driver and matches the right update for your exact hardware.Free scan · exact hardware matchPC Slower Than It Used to Be?
A free scan shows the junk files, broken settings and background clutter dragging Windows down - then fixes them in one click.Free scan · Windows 10 & 11#1 Best Overall

- High Efficiency: The computer graphics card tester can quickly detect faults such as no display, blurry display, and unstable display without the need for individual measurements of the PCI bus interface between the graphics card and motherboard using a multimeter. It can accurately identify issues like short circuits and CPU failures with rate, making it an essential tool for graphics card repairs.
- Versatile Testing Capabilities: The graphics card tester diagnostic tool is specifically designed to test the data bus connections between the graphics card CPU and the computer motherboard's PCI interface for open circuits and short circuits.
- Comprehensive Fault Diagnosis: When troubleshooting computer graphics card issues, the graphics card diagnostic analyzer tester allows technicians to inspect for burn marks, broken PCB traces, and abnormal voltages before conducting further tests. This comprehensive approach helps in identifying underlying problems accurately and efficiently.
- User Friendly Operating: The display video graphics card tester is designed for ease of use, with a simple setup process involving inserting the faulty card into the corresponding slot, applying a 12V power supply, and pressing the push buttons switch. The indicator lights on the tester provide clear feedback on the status of the graphics card, allowing for quick and accurate fault diagnosis.
- Accurate Fault Localization: The graphics card tester with Light's indicator lights offer quick feedback on the condition of the graphics card, helping technicians pinpoint issues with the main CPU chip such as open circuits or short circuits. In case of any anomalies in the indicator lights, further confirmation using a multimeter can be done to accurately locate the fault points, ensuring thorough troubleshooting and repair.
- FPS fell from approximately 160 to 20.
- The slowdown lasted roughly 10 seconds.
- It repeated approximately every 15 seconds.
- It occurred in every game, not just one title.
- The computer also became affected while using Google, suggesting that the problem was not limited to 3D rendering.
The listed system used a GTX 1060 3GB, an AMD FX-6300 processor, 8 GB of RAM, a 1 TB Toshiba hard drive, and Windows 10 as described at the time. Those specifications provide useful context, but they do not establish that any one component was defective or that 8 GB of memory was the cause.
The poster had already tried changing NVIDIA settings, enabling maximum-performance power settings, updating and rolling back graphics drivers, disabling Windows indexing, disabling “Quiet n’ Cool” in the BIOS, rebooting, cleaning dust, restarting the GPU, lowering game settings, checking for viruses, and using CCleaner. None of those attempts proves that it fixed the issue.
Why this symptom points to a system-level problem
A graphics setting normally affects a particular game or workload. A repeating slowdown that also affects browsing points to something outside the game. The timing is especially important: a regular cycle suggests that a process, service, scheduled task, driver event, storage operation, or thermal/power state may be waking up or changing repeatedly.
That is an informed diagnostic interpretation, not a confirmed diagnosis of the historical computer. Possible causes include:
The Tool Desk
Outbyte Driver Updater FREEFix the driver behind crashes, sound loss and screen glitchesFind Drivers →Outbyte PC Repair FREERepair Windows errors before they cause bigger problemsFix Now →- A background process or scheduled task: updates, security scans, indexing, overlays, telemetry, synchronization, or another utility may consume CPU, memory, or disk time.
- Storage contention: a mechanical hard drive may become saturated by paging, downloads, indexing, game activity, or maintenance. The hard drive itself could also be deteriorating.
- Thermal or power behavior: overheating, inadequate airflow, a failing fan, power limits, or an unstable overclock can reduce clock speeds or cause momentary instability.
- Driver or operating-system interference: a display, chipset, storage, audio, or Windows component can interrupt the workload even when the game itself is configured correctly.
- Hardware instability: defective memory, a motherboard, CPU, GPU, storage device, or power supply can imitate a graphics-card problem.
First: capture the next slowdown instead of changing more settings
The most valuable evidence is what changes at the exact moment the FPS drops. Reproduce the problem while monitoring the system, and write down the time of each event. Do not rely only on average FPS: a short system stall can produce a severe frame-time spike while the average looks normal.
Rank #2

- Temperature Data Logger Features: 2-year shelf life | Automatic PDF & CSV reports |B086YZLBM1 Thermal Mapping|Area Mapping| Up to 180 days recording time | Re-programmable by user | Records every temperature fluctuations | Compact & Slim design | Secured tamper-proof PDF report file | LED light indication for current temperature status
- Most economical temp. monitoring device in cold chain logistics | Protective cover: waterproof and food-safe | No additional software required to generate report | Reports in Graphical and Tabular manner
- Type: Disposable/Single Use | Temperature Range: -22°F to 158°F / (-30°C to 70°C) | Temperature Accuracy: ±0.5 (-20°C/+40°C) | Resolution: 0.1°C | Sensor: Internal | Sampling Memory: Data Storage Capacity: 16,000 readings | Alarm Configuration: Optional, up to 5 points | Connectivity: USB 2.0
- Recording Interval: 10 minutes | Recording Duration: 110 Days | LED Indication: Yes | LCD Display: No | Configuration: User Configurable | PC connectivity: In-Built USB | Report Format: CSV, PDF | Protection Class: IP67 / NEMA 6 | Battery Life: 2 years.
- Supply Scope: 2 units of Tempmate S1 Datalogger | Applications: Food Industry, Pharmaceuticals industry, Refrigerator Trucks, Reefer ships, Reefer cars, Refrigerator ships, Warehouse.
Use Task Manager as the first check
- Press Ctrl + Shift + Esc to open Task Manager.
- If the compact view appears, select More details.
- Open the Performance tab and watch CPU, Memory, Disk, Ethernet, and GPU activity while reproducing the drop.
- When the slowdown occurs, switch to Processes and sort by CPU, Memory, and Disk in turn.
- Look for a process whose activity rises at the same time as the FPS collapse.
Task Manager can show that a resource is busy, but correlation matters more than a single high percentage. For example, high CPU use that occurs after the frame drop may be a consequence rather than the cause. A process that spikes at every 15-second interval is more interesting than one that remains steadily active.
Record more than utilization
If available, record the following during both a normal period and a bad period:
| Metric | What a change may suggest |
|---|---|
| CPU utilization and per-core load | A process, game thread, driver activity, or a CPU bottleneck. Per-core saturation matters on older processors even when total CPU usage is not 100%. |
| Memory usage and commit pressure | Paging or memory contention. This does not by itself prove that physical RAM is defective or that more RAM is the solution. |
| Disk active time and transfer rate | Storage saturation, paging, indexing, downloads, updates, or a drive problem. |
| GPU utilization | Whether the GPU is still rendering normally or has become starved by another part of the system. |
| CPU/GPU temperature | Possible cooling, airflow, fan, or thermal-throttling behavior when paired with a clock-speed change. |
| CPU/GPU clock frequency | A sudden frequency reduction can point toward thermal, power, firmware, or stability problems. |
| Frame time and dropped frames | Whether the event is a true rendering slowdown, a short stall, or a presentation/latency problem. |
For more detailed measurement, NVIDIA FrameView can capture average, minimum, percentile, and dropped-frame information along with render-present latency, CPU and GPU utilization, temperatures, frequencies, driver details, operating-system information, and hardware metadata. A log that includes the exact time of a frame-time spike is much more useful than a list of settings that were changed at random.
Quick wins for a faster PC:
Repair Windows errors before they cause bigger problemsFix Now →Scan for outdated or missing drivers - takes under a minuteDriver Scan →How to interpret what you find
If one non-game process spikes
Identify the process before ending it or uninstalling anything. Check its publisher and file location, then investigate its startup entry, scheduled tasks, update activity, overlay features, indexing behavior, synchronization, or security-scanning schedule. A process name alone is not proof that it is malicious or unnecessary.
Temporarily closing a confirmed, nonessential overlay or utility can be a useful test. Change one thing at a time and reproduce the problem again. If the drops stop, restore items individually to identify the responsible component rather than leaving important security or system services disabled without a reason.
Rank #3

- Temperature Range: -30°C to 70°C|Thermal Mapping|Area Mapping|single use data logger|temperature humidity data logger
- Temperature Accuracy: ±0.5 (–20°C/+40°C); Resolution: 0.1°C|Thermal Mapping|Area Mapping|thermocouple data logger|temperature recorder
- Data Storage Capacity: 16000 Readings
- Battery Life: 2 years
- Applications: Food Industry, Pharmaceuticals industry, Refrigerator Trucks, Reefer ships, Reefer cars, Refrigerator ships, Warehouse.
If Disk reaches 100% active time
Check whether Windows is paging, a game is loading data, an update or download is running, or indexing and security scanning are active. On a mechanical hard drive, high active time can occur even when the reported transfer rate appears modest.
Also treat repeated disk saturation, unusual noises, corrupted files, very slow booting, or application hangs as possible storage-health warnings. Back up important files before performing stressful tests or replacing software. Do not assume that installing an SSD will automatically cure the problem; it may reduce storage waits while leaving a driver, thermal, power, or hardware fault untouched.
If temperature rises while clocks fall
Power the PC down, inspect the fans and vents, confirm that fans spin normally, and improve airflow. Remove dust carefully and avoid forcing a fan to spin freely with compressed air. A compressed air duster for PC cleaning can help with a maintenance step when the computer is powered off and handled safely, but cleaning is only a diagnostic possibility—not proof of the root cause and not a guaranteed FPS fix.
Do not interpret a high temperature by itself as a diagnosis. Temperature limits vary by component and workload. The important pattern is a repeatable temperature or clock change that coincides with the frame-time collapse.
If both CPU and GPU utilization fall during the stall
This pattern can indicate that the game is waiting on another resource rather than simply asking the GPU to render more slowly. Storage waits, a blocking driver or system event, process scheduling, or hardware instability are possible explanations. It is an inference from the telemetry, not proof of one particular fault.
If the GPU is fully loaded but FPS falls
Check whether the GPU temperature or clock changes at the same time. If neither changes, investigate a game-specific workload, resolution or settings issue, frame limiter, or driver behavior. However, because the historical report also affected browsing, do not stop the investigation at graphics settings if the system-wide symptom remains.
Rank #4
- HIGH EFFICIENCY DIAGNOSIS: Our graphics card tester with light quickly identifies common faults like no display, blurry screen, or unstable output without complex multimeter measurements. The built-in LED indicators provide instant visual feedback on issues such as short circuits or CPU failures, saving technicians valuable troubleshooting time.
- DUAL INTERFACE COMPATIBILITY: This versatile graphics card diagnostic tool supports both AGP and PCI-E slots, making it ideal for testing a wide range of modern and legacy graphics cards. The universal design ensures compatibility with most computer systems and graphics card in repair shops.
- COMPREHENSIVE FAULT DETECTION: The display video graphics card tester examines multiple failure points including burn marks, broken PCB traces, and abnormal voltages. Its advanced diagnostic capabilities help pinpoint exact issues between the graphics card CPU and motherboard's PCI interface.
- USER-FRIENDLY OPERATION: Simply insert your faulty graphics card into the corresponding slot, connect the 12V power supply, and press the test button. The clear indicator lights and straightforward interface make this computer accessory accessible even for beginners in electronics repair.
- ACCURATE TROUBLESHOOTING TOOL: With precise fault localization technology, our graphics card tester diagnostic analyzer helps identify problems with main CPU chips through its intelligent LED indication system. The included data cable and manual provide additional support for thorough diagnostics.
Work through software changes systematically
Once telemetry has been captured, review what changed immediately before the problem began:
- Windows updates or upgrades
- Game patches or launcher changes
- Display-driver installation or rollback
- Motherboard chipset or firmware changes
- Antivirus, antimalware, backup, synchronization, or overlay software
- Overclocking, undervolting, BIOS changes, or new peripheral utilities
NVIDIA’s troubleshooting guidance recommends checking recent game or application updates, repairing damaged game files where appropriate, reinstalling display drivers when necessary, installing current motherboard chipset drivers, reducing unnecessary background applications, and considering interference from antivirus or antimalware software.
Use official Windows, NVIDIA, AMD, motherboard, and device-manufacturer sources for drivers. A clean display-driver installation can be a reasonable controlled test when the evidence points toward the display stack, but repeatedly installing and rolling back drivers without recording results makes the cause harder to isolate.
PC “optimizer” and automatic driver tools should not be treated as guaranteed cures. Outbyte describes PC Repair as a Windows repair and optimization tool and Driver Updater as a tool that scans devices and recommends driver updates. Such tools may be useful for software inventory or investigation, but their descriptions do not establish that they diagnose or fix this specific every-15-seconds FPS-drop pattern. Check current terms, availability, and privacy implications before installing any third-party utility, and prefer official drivers first.
Recommended Free Tools
If the investigation instead points to broader Windows repair, cleanup, or stability issues, Outbyte PC Repair is an optional tool to consider, not a guaranteed fix for this FPS pattern.
If the evidence points to a missing or outdated Windows driver, Outbyte Driver Updater is an optional way to review driver recommendations, but official manufacturer sources remain the first choice.
Return the PC to a known-stable hardware state
- Remove overclocks temporarily. Return CPU, GPU, and memory settings to stable defaults. Include undervolts and aggressive memory profiles in this test.
- Check power delivery. Confirm that the power supply is appropriate for the system and that GPU power connectors are seated. A power-supply limitation is a possibility, not a conclusion from the FPS symptom alone.
- Inspect cooling. Check fans, heatsinks, vents, case airflow, and thermal behavior under load.
- Test memory. Use a reputable memory diagnostic and, where practical, test modules individually or at default settings.
- Check storage health. Back up data first, then use appropriate manufacturer or operating-system diagnostics. Repeated file errors or health warnings justify replacing the drive rather than merely reinstalling games.
- Isolate components. If software telemetry finds no explanation, test with known-good components or remove nonessential hardware one change at a time.
NVIDIA identifies dust, poor ventilation, overheating, overclocking, power-supply limitations, and defective CPU, memory, motherboard, hard-drive, or system-memory components as possible sources of instability that can look like a graphics-card problem. These are diagnostic branches, not evidence that any one of them caused the original case.
Independent reader supportYour contribution helps us test, update, and keep practical guides available for everyone.What the original troubleshooting attempts do—and do not—tell us
- Lowering game settings: useful for testing GPU load, but unlikely to solve a system-wide stall that affects browsing.
- Maximum-performance NVIDIA settings: may alter power-state behavior, but does not rule out CPU, storage, background-process, thermal, or hardware problems.
- Driver update or rollback: relevant if the issue follows a driver change, but neither action proves the driver was responsible.
- Disabling indexing: a reasonable test if disk activity aligns with the drops, but not a confirmed fix in this case.
- Virus checks: worthwhile, but a clean scan does not eliminate ordinary background software or hardware faults.
- Dust cleaning: sensible maintenance when done safely, but it does not prove overheating caused the drops.
- CCleaner or similar cleanup: removing temporary files does not diagnose intermittent scheduling, driver, storage, or power events.
What should not be concluded from this case?
The available discussion does not justify claiming that:
What’s actually slowing this PC down?
Pick the symptom - the matching free tool is one click away.
Best Value
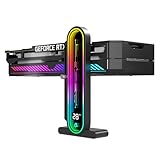
- Integrated Temperature Monitoring:Precisely tracks internal chassis temperature fluctuations to assist in optimizing thermal management for system stability.
- Multi-Range Height Adjustment:The graphics card bracket design can be compatible with various chassis and graphics card, support height is from 35 to 157mm.
- Non-Slip GPU Protection Pad:Single-layer silicone contact surface with vibration dampening properties prevents graphics card movement while providing scratch-resistant protection during installation and operation.
- Dual Recessed Magnetic Base with Protective Silicone:Integrated dual recessed magnets stabilize the bracket position, while silicone-encapsulated magnetic contacts prevent chassis surface abrasion during installation and adjustment.
- 8 GB of RAM was definitely the cause.
- The GTX 1060, FX-6300, Toshiba hard drive, or Windows 10 installation was proven defective.
- Malware, Windows indexing, NVIDIA settings, overheating, or dust was confirmed as the cause.
- The forum’s marked “solution” was the original poster’s verified final fix.
- A compressed-air duster, optimizer, driver updater, or hardware upgrade will resolve the problem.
A practical decision tree
- Does browsing or the desktop also freeze? If yes, prioritize system telemetry over game settings.
- Does a process spike at the exact moment? Investigate that process, its scheduled tasks, and its parent application.
- Does disk active time saturate? Investigate paging, downloads, indexing, security scans, and drive health.
- Do temperature and clock speed change together? Test cooling, airflow, power limits, and default hardware settings.
- Do frame-time spikes occur without an obvious resource spike? Capture a detailed log, update or reinstall relevant drivers in a controlled way, and test memory, storage, and hardware stability.
- Does the problem disappear after one controlled change? Revert and repeat the test to confirm the result before declaring the cause solved.
Bottom line
The dependable lesson from the “160 to 20 FPS every 15 seconds” case is not a hidden graphics setting or a confirmed defective component. It is the troubleshooting method: because the drops occurred in all games and during browsing, observe the entire system at the precise moment of the stall. Correlate frame time with processes, CPU and GPU clocks, temperatures, memory pressure, disk activity, drivers, and hardware stability. The historical thread does not reveal the original poster’s confirmed final fix, so any article claiming certainty about the cause would be overstating the evidence.
Frequently Asked Questions
Why does my FPS keep dropping from 160 to 20 every few seconds in every game?
Because the slowdown also occurred while browsing, the problem was probably not limited to one game’s graphics settings. A repeating system-wide stall can come from a background process, disk activity, paging, a driver or Windows event, thermal or power behavior, or unstable hardware. The historical discussion does not confirm which one was responsible.
How can I find what is causing periodic FPS drops?
Open Task Manager with Ctrl+Shift+Esc, select More details, and watch CPU, Memory, Disk, and GPU on the Performance tab. During the drop, check Processes and sort by CPU, Memory, and Disk. The useful result is a resource or process change that occurs at the same moment as the FPS collapse.
Was 8 GB of RAM definitely the cause?
Not necessarily. Eight gigabytes may create memory pressure in some modern workloads, but this case does not prove that RAM capacity or a defective memory module caused the recurring drops. Check memory usage and paging during the event before buying an upgrade.
What was the confirmed fix in the original solved thread?
The available historical discussion labels a reply as the solution, but it does not include a final first-person confirmation from the original poster identifying the successful repair. It is safer to treat the case as an example of a diagnostic workflow than as proof of one particular fix.
The Bottom Line
Recurring FPS drops across every game and even browsing should be diagnosed as a system-level interruption. Capture Task Manager or detailed telemetry during the exact drop, then follow the evidence toward a background process, storage contention, thermal or power behavior, driver issue, or hardware instability. The historical case was marked solved, but its available discussion does not identify a verified final fix.
Quick Recap
Product prices and availability are accurate as of the date/time indicated and are subject to change. Any price and availability information displayed on Amazon at the time of purchase will apply.



