In January 2012, The NPD Group reported that U.S. retail sales of new video-game hardware, software, and accessories fell 21 percent in December 2011, to $3.99 billion from $5.07 billion a year earlier. For calendar 2011, the same retail measure fell 8 percent, to $17.02 billion. Both percentages describe new products sold through retail channels. They do not describe every way people spent money on games that year, such as used games, rentals, subscriptions, and downloads, which NPD tracked as a separate, broader estimate.
What the two percentages measure
Both headline figures are NPD estimates of U.S. retail sales, as reported by GameSpot in January 2012. They cover three product groups: hardware (consoles and portable systems), accessories, and software. The figures are dollar revenue estimates. They are not unit counts, and they say nothing about sales outside the United States.
| Measure | Period | Value | Change from prior year | What it includes |
|---|---|---|---|---|
| U.S. new retail total | December 2011 | $3.99 billion (December 2010: $5.07 billion) | −21% | Hardware, non-PC software, accessories |
| U.S. new retail total | Calendar 2011 | $17.02 billion | −8% | Hardware, non-PC software, accessories |
| All-channel game-content spending (preliminary) | Calendar 2011 | $16.3 billion to $16.6 billion | About −2% | Used games, rentals, subscriptions, full-game and add-on downloads, mobile and social games. Excludes hardware and accessories. |
The first two rows are directly comparable with each other. The third row is not a broader version of the retail total. It leaves out hardware and accessories and adds channels that retail figures do not capture, so it should be read as a separate measure.
Why December fell 21 percent
December normally carries a large share of the year’s sales. NPD analyst Anita Frazier said December 2011 accounted for just 23 percent of annual sales, against a ten-year average of 28 percent. Frazier had expected a bigger share because of the strong slate of content released in the fourth quarter. She said:
Recommended Free Tools
#1 Best Overall

- 5 GAMES INCLUDED. UNLOCK MORE WITH PLAY PASS. Playground comes with Fruit Ninja, Starri, Whac-a-Mole, Go Keeper, and Party Fowl. A separate purchase of a 3-Month ($49) or 12-Month Play Pass ($89) is required to access the full catalog of games and get new games each month, including Barbie, Teenage Mutant Ninja Turtles, How to Train Your Dragon, Peppa Pig, Care Bears, Elmo, Miraculous Ladybug, Gabby's Dollhouse, Kung Fu Panda and more.
- GET MOVING WITH ACTIVE FAMILY FUN. Nex Playground is a new kind of video game console that gets your family moving. It easily connects to your TV, transforming your living room into an active play space. Within minutes, your family will be playing Fruit Ninja, Whac-a-Mole and more. Using a built-in camera to track motion and natural body movements, anyone in the family can jump right in.
- JUST USE YOUR BODY TO PLAY. Play naturally just by moving your body. Playground uses the magic of AI to follow your movements using the built-in wide-angle camera. No controllers or clunky trackers! Up to 4 players can play at the same time, so everyone can get moving together.
- GAMES YOU'LL LOVE MOVING TO. Playground is packed with interactive motion games, turning your living room into an arcade, theme park, gym, and more. There is something for everyone. It is perfect for indoor family game night, after school activities, or a playdate with friends.
- EASY SET UP. Playground connects to your TV or projector with a simple HDMI connection and gets everyone in on the fun. It's small and sits elegantly on any console or mantle, and can easily fit in a backpack for playdates and more. From ages 5 and up—Playground is the life of every party.
“Because of the great slate of content that came to market during the fourth quarter, I had expected December sales to represent a larger portion of total year sales than what occurred. This year, December accounted for just 23 percent of annual sales, while the average for the past ten years was 28.”
Frazier’s quote is as reproduced by GameSpot in its December 2011 sales report. The reporting does not attribute the drop to a single cause.
To see why the share matters, apply the ten-year average to the 2011 total as a simple illustration: 28 percent of $17.02 billion is roughly $4.77 billion. That is not an NPD figure. It shows that a December at the typical share would have been well above the $3.99 billion that was reported.
Rank #2

- 6.2” LCD screen
- Three play modes: TV, tabletop, and handheld
- Local co-op, online, and local wireless multiplayer
- Detachable Joy-Con controllers
- Nintendo Switch is the home of Mario & friends
December by category
| December 2011 category | Value | Change from December 2010 |
|---|---|---|
| Hardware | $1.32 billion | −28% |
| Accessories | $628.7 million | −27% |
| Non-PC software | $2.04 billion | −14% |
| Total software, including PC games | $2.14 billion | −15% |
| Total retail (hardware, non-PC software, accessories) | $3.99 billion | −21% |
The published components add up to the $3.99 billion total only when non-PC software ($2.04 billion) is used. PC game software is shown separately and is not included in the headline total.
Do these 3 things before closing this tab:
1Clear out junk files and repair common Windows errors2Scan for outdated or missing drivers - takes under a minute3Repair Windows errors before they cause bigger problemsHow the full year broke down
| Calendar 2011 category | Value | Change from 2010 |
|---|---|---|
| Hardware (non-PC) | $5.58 billion | −11% |
| Accessories | $2.61 billion | −11% |
| Software (non-PC) | $8.83 billion | −6% |
| Total retail (hardware, non-PC software, accessories) | $17.02 billion | −8% |
| Memo: total software, including PC games | $9.27 billion | −8% |
These figures reconcile: $5.58 billion plus $2.61 billion plus $8.83 billion equals $17.02 billion. Software, which is the largest category, fell the least in percentage terms. Hardware and accessories each fell 11 percent. The total software line, including PC games, fell 8 percent, while non-PC software fell 6 percent, which implies PC game software declined by a larger percentage. The reporting cited here does not give a PC-only percentage, and because the figures are rounded, any PC-only change calculated from them is approximate.
Does the broader spending estimate change the picture?
NPD’s all-channel estimate covers what consumers spent on game content across several channels in 2011:
Rank #3
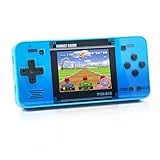
- Kids Friendly Design: This P30S handheld game console is specially designed for kids. It has a stylish arcade - like appearance. The body fits a child's hand, and the game settings also cater to kids psychology, thus being very attractive.
- Excellent Gaming Experience: Equipped with a 3.0 - inch high - definition screen and excellent speaker sound, it provides an excellent visual and auditory experience for video games. This handheld game console is small and lightweight, convenient for kids to use and carry. Its ergonomic design ensures a comfortable grip, allowing children to fully enjoy the games.
- Rich Collection of Classic Games: This retro handheld game console contains 220 interesting kids video games, including various types such as entertainment, sports, and adventure games, just like those found in many retro game consoles. While playing these games, kids can cultivate skills such as hand - eye coordination, thinking, and problem - solving.
- Convenient Rechargeable and Long - lasting Battery: The video game console is equipped with an 860mAh lithium - ion battery. It ensures that kids can play games without interruption, because there is no need for frequent battery replacement, which is very suitable for playing portable games outdoors. It is a great addition to the world of handheld games for children and can bring more fun to them.
- Absolutely Surprising Gift: Our handheld game toy is a surprising gift for kids, teenagers, and even adults. It is the best gift for birthdays, Christmas, Halloween, and Thanksgiving. Customer satisfaction is our top priority. Our customer support team will serve you wholeheartedly.
- Used games
- Full-game and add-on (downloadable content) downloads
- Mobile and social games
- Subscriptions
- Rentals
That spending was preliminary and was estimated at $16.3 billion to $16.6 billion, about 2 percent below 2010. The decline is far smaller than the 8 percent retail drop because growth in the non-retail channels offset much of the loss in new physical retail. Frazier put it this way, as quoted by GameSpot in its annual report:
“The increase in these areas partially offset the decline in new physical retail sales of content in 2011.”
Windows Errors? Fix Them Before They Spread
Repair common Windows errors and clear accumulated junk for a smoother, more stable PC - no reinstall needed.Free scan · no reinstallOutdated Drivers Are Slowing You Down
One free scan finds every outdated or missing driver and matches the right update for your exact hardware.Free scan · exact hardware matchHow the industry trade group defines digital sales
The Entertainment Software Association’s 2012 annual report also presents 2011 consumer spending and cites NPD’s Games Market Dynamics: U.S. as its source. In its sales-information section, it defines digital format sales as subscriptions, digital full games, digital add-on content, mobile apps, and social-network gaming. That framing is useful for understanding what “digital” means in these figures, but it is industry context rather than a restatement of the retail totals in the headline.
Rank #4

- Controllers are original OEM (not 3rd party)
- Tested and works well. Nice condition
Which games led the charts
GameSpot’s December 2011 report, based on NPD data, ranked the month’s top titles as follows:
- Call of Duty: Modern Warfare 3 (Xbox 360, PS3, and PC)
- Just Dance 3
- The Elder Scrolls V: Skyrim
- Mario Kart 7
- Battlefield 3
Modern Warfare 3 also ranked first on GameSpot’s calendar-2011 chart. The rankings show which titles sold best within the tracked retail group. They do not explain why total retail spending fell.
Quick Recap
What these figures do not measure
- Global sales. The totals cover the United States only.
- Unit sales. The figures are dollar estimates. Percentage changes in them should not be read as changes in the number of units sold.
- Total industry revenue. The retail totals exclude PC game software, and the all-channel estimate excludes hardware and accessories. Neither is the whole industry.
- Audited totals. These are NPD estimates. This article relies on GameSpot’s reporting of NPD’s figures and on the ESA’s 2012 annual report, which cites NPD. It does not reproduce NPD’s original press release, so the quotations come from GameSpot’s reproduction of Frazier’s remarks.
- Causes. The reporting describes the declines and the chart leaders. It does not establish why spending fell in each category.
Product prices and availability are accurate as of the date/time indicated and are subject to change. Any price and availability information displayed on Amazon at the time of purchase will apply.
Free tools Windows power users keep installed
One-click scans. No signup required.



