The right way to benchmark a graphics card depends on the question you are trying to answer. A synthetic benchmark can compare one GPU with another, a game benchmark can estimate real-world performance, frame-time analysis can reveal stutter that average FPS hides, and a stress test can expose instability or cooling problems. These are related tests, but they are not interchangeable.
For a useful result, keep the hardware, drivers, game settings, test route, and ambient conditions consistent; run more than once; record frame-time and temperature data alongside average FPS; and label features such as ray tracing, upscaling, and frame generation clearly.

As an Amazon Associate I earn from qualifying purchases.
What a graphics-card benchmark should tell you
Before installing a benchmark, define the result you need:
The Tool Desk
Outbyte Driver Updater FREEScan for outdated or missing drivers - takes under a minuteDriver Scan →Outbyte PC Repair FREEClear out junk files and repair common Windows errorsFree Scan →- Performance comparison: Which GPU is faster under the same workload?
- Gaming performance: What frame rate can this card deliver in a particular game, resolution, and quality mode?
- Frame-pacing analysis: Does it deliver frames consistently, or are there stutters despite a high average FPS?
- Thermal and power testing: How hot does it get, how much power does it use, and does it reduce its clock speed under sustained load?
- Stability testing: Does the system remain reliable after a new installation, overclock, undervolt, cooling change, or hardware upgrade?
A single score cannot answer all of these questions. A benchmark pass is a measurement of one workload, not a universal rating for every game and not proof that a graphics card is stable.
#1 Best Overall

- Real Base Clock: 1721 MHz / Real Boost Clock: 1860 MHz; Memory Detail: 8192MB GDDR5X
- Completely adjustable RGB LED using EVGA Precision XOC;VR Ready
- What you see is what you get. – No additional software required to achieve listed clock speeds
- Double BIOS, Refer user manual below. Operating System Support : Windows 10 32/64bit ,Windows 8 32/64bit and Windows 7 32/64bit
- DX12 OSD Support with EVGA Precision XOC. All with the lowest latency and plug-and-play compatibility with leading VR headsets.
1. Record your baseline before testing
Write down the system configuration before running a benchmark. At minimum, record:
- Exact GPU model and VRAM capacity
- CPU model and system memory capacity
- Operating-system version
- Graphics-driver version
- GPU clock, power-limit, overclock, or undervolt settings
- BIOS or VBIOS details when relevant to a hardware review or troubleshooting case
- Display resolution and refresh rate
- Benchmark or game name and exact version
- Graphics API, such as DirectX 12 or Vulkan
- Preset, render scale, ray-tracing settings, upscaler, and frame-generation settings
Save screenshots or log files when practical. This prevents a later driver update, game patch, changed power limit, or different upscaling mode from being mistaken for a hardware improvement.
2. Prepare a repeatable test environment
Use the same configuration for every comparison. Keep the resolution, preset, render scale, texture quality, ray tracing, upscaler, sharpening, frame generation, frame cap, and synchronization settings unchanged unless the test specifically examines one of those variables.
Recommended Free Tools
Let the computer reach a repeatable idle condition before each run. Avoid downloads, operating-system updates, browser video, game launchers doing background work, recording, and other tasks that compete for CPU time, memory, storage, or network resources. Keep the case position, fan profile, room conditions, and monitor configuration consistent when temperature or power is part of the test.
Do not compare results made with materially different drivers, power limits, or image-reconstruction modes without labeling the difference. If you change a variable, change one thing at a time and identify it in the report.
3. Choose the right benchmark
Synthetic benchmarks for controlled comparisons
Synthetic tests are useful when you want a standardized workload that can be repeated across graphics cards. The appropriate 3DMark test depends on the workload:
- Steel Nomad: A demanding general-purpose test for modern, non-ray-traced graphics performance. On a full Windows PC run, it renders at 4K and uses DirectX 12; 3DMark also supports other APIs and platforms where applicable.
- Time Spy: A DirectX 12 test at 2560×1440.
- Time Spy Extreme: A 4K DirectX 12 workload.
- Speed Way: A DirectX 12 Ultimate ray-tracing workload.
- Port Royal: A dedicated ray-tracing performance test.
Steel Nomad is a sensible modern general-purpose choice for high-end, non-ray-traced comparisons, while Time Spy remains useful when you specifically want a 1440p DirectX 12 comparison. Speed Way and Port Royal are more relevant to ray-tracing behavior. Do not present a synthetic score as a guaranteed FPS figure in every game: engines, APIs, drivers, CPU limits, and settings can produce very different results.
Use a current, supported test when comparing modern hardware. Legacy benchmark results may not be appropriate for current GPUs, and a score is only comparable when the test version and configuration match.
Rank #2

- Chipset: NVIDIA GeForce GTX 1080
- Video Memory: 8GB GDDR5X. OpenGL version support: 4.5
- Max. Resolution: 7680 x 4320, support 4x Display monitors
- Input: 1x 6Pin PCI-E power connector, 1x 8Pin PCI-E power connector, output: DVI-D Dual Link, HDMI, 3x DisplayPort's
- 500W system power supply requirement; 180W power consumption. Dimensions: 279 x 140 x 42 mm.
UNIGINE Superposition
UNIGINE Superposition is another option for graphics testing. It provides temperature and clock monitoring, leaderboards, and a looped stress-test mode. Its extended workload is intended to help assess reliability and performance after building or upgrading a PC or changing GPU settings.
Superposition can be useful for a quick comparison or a sustained-load check, but use the same preset, resolution, API, duration, and system conditions for every run. The looped mode is a stress test, not a substitute for a game benchmark.
Real games for realistic results
Use several games that represent the workloads you actually care about. A useful selection might include:
Quick wins for a faster PC:
Repair Windows errors before they cause bigger problemsFix Now →Fix the driver behind crashes, sound loss and screen glitchesFind Drivers →- A rasterized game without ray tracing
- A demanding ray-traced game
- An esports title that may be CPU-limited at high frame rates
- A VR, compute, or other specialized workload if relevant to your use
Prefer a game’s built-in benchmark when it is repeatable and representative. Otherwise, record the same gameplay route for the same duration each time. A repeatable route might include a fixed save point, identical camera movement, and a defined run length.
Report the resolution and image-quality settings exactly. “Ultra at 1440p” is incomplete if the reader does not know whether ray tracing, dynamic resolution, DLSS, FSR, XeSS, or frame generation was enabled.
4. Run enough passes to check repeatability
Run at least three completed passes for a basic repeatability check. Record every result rather than keeping only the best score. If the numbers differ substantially, stop and investigate before calculating an average.
Large variation can come from background activity, changing GPU temperature, boost-clock behavior, power limits, an unstable overclock or undervolt, shader compilation, streaming delays, or a benchmark that does not begin from the same state. A result that is unusually high or low may be an outlier rather than evidence of a faster or slower card.
For each test, report the number of runs, the individual results or their spread, and whether the published figure is an average. If you are comparing two cards, use the same run policy for both.
Rank #3
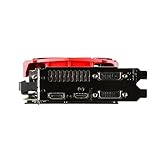
- AMD Radeon R9 390 GPU
- 8GB 512-bit GDDR5 VRAM
- DisplayPort, 2 DL-DVI-D and HDMI
- CrossFire ready
- DirectX 12
5. Measure frame pacing, not just average FPS
Average FPS is useful, but it can hide intermittent stutter. Frame time is the time required to produce one frame; lower and more consistent frame times generally feel smoother.
Tools such as OCAT can record average FPS, average frame time, missed frames, and 99th-percentile frame time. PresentMon can capture CPU, GPU, and display frame durations and latencies. Its service can also combine frame data with telemetry such as temperature, power, and utilization.
A practical gaming report should include:
- Average FPS
- A percentile metric, such as 99th-percentile frame time or a clearly defined low-percentile FPS figure
- A short description of visible stutter or hitching
- The test route and duration
Be precise about terminology. “1% low FPS,” “99th-percentile frame time,” and vendor-specific stutter-rate calculations are related but are not automatically identical. State which tool and calculation produced the number.
6. Monitor temperature, clocks, utilization, and power
During each run, record the GPU temperature and, where available, hotspot temperature, GPU utilization, core and memory clocks, VRAM usage, fan speed, and board power. Peak values are often as important as averages: a card may perform well initially but reduce its clocks after several minutes of heat buildup.
AMD Software: Adrenalin Edition can display and log FPS, frame time, 99th-percentile FPS, stutter rate, GPU utilization, clocks, total board power, temperatures, fan speed, and memory utilization. NVIDIA FrameView is designed to capture performance and power data across major graphics APIs and can save detailed logs, including frame rates, frame times, power usage, and performance per watt.
Telemetry labels matter. “GPU board power” is not the same as power drawn by the entire PC. If you need whole-system wall consumption, use a plug-in power meter between the computer and the wall outlet. It complements software telemetry but does not isolate the graphics card. Report the two measurements separately rather than treating them as interchangeable.
Optional equipment for repeatable testing
Most gamers need no special hardware beyond a monitoring tool. Enthusiasts who swap cards frequently may find an open-air PC test bench convenient for access, component changes, and consistent mounting. It is not required for ordinary benchmarking, and it does not automatically make results more accurate: the same driver, cooling arrangement, fan profile, and test procedure still matter.
Outdated Drivers Are Slowing You Down
One free scan finds every outdated or missing driver and matches the right update for your exact hardware.Free scan · exact hardware matchPC Slower Than It Used to Be?
A free scan shows the junk files, broken settings and background clutter dragging Windows down - then fixes them in one click.Free scan · Windows 10 & 117. Diagnose the bottleneck before interpreting the score
High GPU utilization during a repeatable test often suggests that the graphics card is the limiting component, but utilization alone is not proof. A low GPU-utilization result may indicate a CPU limit, frame-rate cap, V-Sync, synchronization overhead, streaming delay, or an application bottleneck.
Use controlled changes to investigate:
- Run the same scene at the same settings and record the result.
- Lower the resolution or graphics workload while leaving the CPU-side settings unchanged.
- Check whether performance increases substantially. If it does, the GPU is probably limiting the test.
- If performance barely changes, inspect CPU thread usage, frame caps, synchronization, game-engine behavior, and background activity.
- Check clocks and temperatures for thermal or power throttling.
Look at individual CPU threads rather than only total CPU utilization. A game can be CPU-limited with moderate overall CPU usage if one important thread is saturated.
For advanced Windows diagnosis, GPUView and Windows Performance Analyzer use Event Tracing for Windows data to show CPU and GPU queues, synchronization, frame timing, and related events. A typical trace workflow is to start a capture, reproduce the benchmarked scenario, stop the capture, and inspect the resulting ETL data. These tools are more complex than an FPS overlay but can reveal queueing and synchronization problems that simple utilization graphs miss.
Rank #4
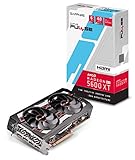
- 4 Outputs 3 x DisplayPort 1 x HDMI
8. Separate performance testing from stability testing
After performance testing, run a dedicated loop or stress test if you installed a card, changed its cooling, or applied an overclock or undervolt. 3DMark stress tests and UNIGINE Superposition’s looped mode can help expose crashes, hangs, visual artifacts, overheating, shutdowns, or inadequate cooling under sustained load.
Do these 3 things before closing this tab:
1Scan for outdated or missing drivers - takes under a minute2Clear out junk files and repair common Windows errors3Fix the driver behind crashes, sound loss and screen glitchesStop immediately if the system crashes, shows persistent artifacts, overheats, or shuts down. Return an unstable overclock or undervolt to stock settings before drawing performance conclusions. A card that produces a high score but crashes later is not a successful benchmark result.
Passing one stress test does not certify stability in every game. Different workloads exercise different shader paths, memory behavior, APIs, and power patterns. For a high-confidence result, combine a synthetic loop with the games or applications the system will actually run.
How to interpret common results
| Observation | Likely interpretation | What to check next |
|---|---|---|
| High GPU utilization and stable clocks | The GPU is probably doing most of the work. | Compare average FPS, frame-time percentiles, temperature, and power with another card. |
| Low GPU utilization and low FPS | Possible CPU, cap, synchronization, streaming, or application limit. | Check per-thread CPU usage, frame caps, V-Sync, and whether lowering resolution changes FPS. |
| Performance falls during a long run | Possible thermal throttling, power limit, or changing workload. | Compare clocks, temperature, hotspot, fan speed, and board power over time. |
| High average FPS but visible hitching | Inconsistent frame delivery or missed frames. | Inspect frame-time percentiles, missed frames, shader compilation, and background activity. |
| Large variation between runs | The procedure or system state is not repeatable. | Check idle state, background processes, thermals, clocks, drivers, and unstable tuning. |
| Good synthetic score but disappointing game FPS | The synthetic workload does not represent that game or the game is CPU-limited. | Run the game’s own benchmark and document its settings and API. |
How to report a graphics-card benchmark
Use a report that lets someone else reproduce the result:
GPU and system
List the exact GPU model, VRAM, CPU, RAM, operating system, driver, and relevant BIOS or VBIOS details. State whether the GPU is at stock settings, overclocked, or undervolted.
Test configuration
List the benchmark or game, version, API, resolution, preset, render scale, ray tracing, upscaler, frame generation, frame cap, synchronization, and run duration.
Results
Include the score or average FPS, frame-time percentile, minimum or low metric if used, GPU utilization, peak temperature and hotspot, clocks, VRAM usage, fan speed, and power. Clearly identify whether power means GPU board power or whole-system wall power.
Repeatability and interpretation
State the number of runs, spread between runs, and whether the published result is averaged. Explain whether the test was GPU-limited, CPU-limited, thermally limited, power-limited, capped or synchronized, or unstable.
End with a caveat that the result applies to the tested software version, driver, settings, and system. This is not needless fine print: those variables can materially change the outcome.
Free tools Windows power users keep installed
One-click scans. No signup required.
The mistakes that make GPU benchmarks misleading
- Comparing different resolutions or presets. A 1440p result cannot be directly compared with a 4K result.
- Reporting one run. One pass may include background activity or an atypical clock state.
- Converting a synthetic score into universal game FPS. Benchmark scores describe their own workloads.
- Omitting ray tracing, upscaling, or frame generation. These settings can radically change the workload.
- Using average FPS to discuss smoothness. Add frame-time data and mention visible stutter.
- Confusing board power with wall power. Software and plug-in-meter readings measure different things.
- Calling one benchmark pass a stability certification. Performance and stability require separate tests.
- Hiding driver differences. A new driver can change performance or frame pacing.
- Ignoring CPU limits, frame caps, V-Sync, or throttling. A GPU may not be the limiting component.
- Leaving out the exact test version and configuration. Without them, the result is difficult to reproduce.
A copy-and-paste benchmark template
GPU and system:
GPU / VRAM:
CPU:
RAM:
Operating system:
Graphics driver:
GPU tuning: Stock / overclock / undervolt

Test:
Benchmark or game and version:
API:
Resolution:
Preset and render scale:
Ray tracing:
Upscaler and mode:
Frame generation:
Frame cap / V-Sync:
Run duration and route:

Results:
Runs:
Score or average FPS:
Frame-time percentile:
Low metric, if used:
GPU utilization:
Peak temperature / hotspot:
Core and memory clocks:
VRAM usage:
Board power or wall power:

Interpretation:
GPU-limited / CPU-limited / thermally limited / power-limited /
capped or synchronized / unstable:
Notes and caveats:
Frequently Asked Questions
How many times should I run a GPU benchmark?
Run at least three completed passes for a basic repeatability check. Report the spread and whether you averaged the results. If the scores vary substantially, investigate background activity, temperature, clocks, power limits, or unstable tuning before publishing a result.
Is average FPS enough to judge graphics-card performance?
No. Average FPS does not show how consistently frames arrive. Include a clearly defined frame-time percentile or low-FPS metric and note any visible stutter, missed frames, or hitching.
What is the best benchmark for a graphics card?
There is no single best test. Use Steel Nomad or Time Spy for standardized non-ray-traced comparisons, Speed Way or Port Royal for ray tracing, and a repeatable built-in game benchmark for actual gaming performance. Use a looped stress test separately for stability.
Does a GPU benchmark prove that an overclock is stable?
No. A benchmark pass measures performance under one workload. Run a sustained stress test and test the games or applications you actually use. Crashes, artifacts, overheating, or shutdowns mean the tuning should be returned to stock and investigated.
What’s actually slowing this PC down?
Pick the symptom - the matching free tool is one click away.
What is the difference between GPU power and wall power?
GPU or board power is a software-reported estimate or measurement associated with the graphics card. A plug-in meter measures the entire computer’s consumption at the wall, including the GPU, CPU, motherboard, drives, fans, and power-supply losses. They should be reported as separate quantities.
The Bottom Line
A credible graphics-card benchmark is a controlled experiment, not a single impressive number. Match the test to the question, document every important setting, run multiple passes, measure frame pacing and thermals alongside FPS, investigate the bottleneck, and use a separate sustained test for stability. With that process, your results become reproducible and meaningful instead of merely comparable-looking.
Quick Recap
Product prices and availability are accurate as of the date/time indicated and are subject to change. Any price and availability information displayed on Amazon at the time of purchase will apply.