What’s actually slowing this PC down?
Pick the symptom - the matching free tool is one click away.
A GPU bottleneck means the graphics processor—or one of its internal resources—is currently limiting performance. In a game, that usually means the GPU needs more time to render each frame than the CPU needs to prepare the next one. But “the GPU is at 99%” is not a complete diagnosis: the limit could be shader arithmetic, memory bandwidth, ray tracing, VRAM residency, synchronization, low clocks, or something else entirely.
The reliable way to find the bottleneck is to measure frame time, compare the same workload at different resolutions or settings, inspect CPU and GPU timing together, and then use hardware counters or a trace when the broad test is not enough.
As an Amazon Associate I earn from qualifying purchases.
What a bottleneck actually means
A bottleneck is the stage or resource that limits throughput or increases latency. For a game, throughput is usually expressed as frames per second, while latency is better represented by frame time—the time required to produce one frame.
Quick wins for a faster PC:
Repair Windows errors before they cause bigger problemsFix Now →Fix the driver behind crashes, sound loss and screen glitchesFind Drivers →The relationship is simple: frames per second = 1,000 ÷ frame time in milliseconds. A 16.67 ms frame corresponds to 60 frames per second; 8.33 ms corresponds to 120 FPS; 6.94 ms corresponds to 144 FPS; and a 20 ms frame corresponds to approximately 50 FPS.
#1 Best Overall
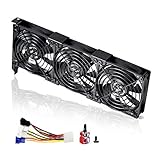
- 3 x 92mm fans combined into one interface, can be connected to the motherboard's 3-pin or 4-pin interface and you only need to access one interface to run all the fans
- This cooling fan's total size is 11in(L) x 4.72in(W) x 1.18in(H), designed for most universal graphic card video card VGA cooling,just please check the size to make sure your pc has enough space
- D-type interface cable included four interfaces, three voltages: 5V, 7V and 12V; different voltages with different airflow, speed and noise. You can select the appropriate voltage interface to start the fan
- The double ball bearing has a service life of 65,000 hours, and the 7 blades produce strong airflow to keep the computer case cool
- packing list: 3 x 92mm fans (PCI bracket screwed), 1 x multi-voltage cable ,1 x mini screwdriver,1 x fixing screw
In a well-overlapped CPU-and-GPU pipeline, the slower stage generally determines the sustainable frame rate. The CPU may prepare commands while the GPU renders earlier work, so the stages are not always added together. Queueing, synchronization, presentation delays, and other serial work can still affect the final result.
GPU-bound versus CPU-bound
A game is GPU-bound when the GPU takes longer to complete its submitted work than the CPU takes to prepare more work. The GPU is then determining the frame time. A game is CPU-bound when the GPU finishes quickly and waits for the CPU to generate additional commands.
These are properties of a particular workload, not permanent labels attached to a computer. The same system may be GPU-bound at 4K with ray tracing enabled, CPU-bound at 1080p with competitive settings, and limited by a single game-engine thread in one scene but not another. Hardware, resolution, visual settings, scene complexity, game version, driver, clocks, and background activity can all change the answer.
A game can also be GPU-bound in the broad sense while being limited by a specific GPU subsystem. The shader execution units, texture units, rasterizer, pixel-processing path, ray-tracing hardware, memory system, cache, queue scheduling, or synchronization may be the resource that needs attention.
Why GPU utilization percentages are easy to misread
GPU utilization is an activity indicator, not a complete performance diagnosis. A reading near 99% tells you that some GPU work is keeping an engine busy. It does not tell you whether the GPU is saturated by arithmetic, waiting on memory, processing textures, performing ray tracing, stalled by synchronization, or running below its expected clock because of a power or thermal limit.
Likewise, low average utilization does not prove that the GPU is irrelevant. A coarse monitor can hide short bursts, alternating engine activity, synchronization gaps, or a workload limited by one engine while the rest of the chip is idle. A game may also be waiting on the CPU, an asset-streaming operation, a shader compilation event, or a presentation barrier.
Use utilization to form a hypothesis. Use frame time, timing traces, clocks, and counters to test it.
The Tool Desk
Outbyte PC Repair FREERepair Windows errors before they cause bigger problemsFix Now →Outbyte Driver Updater FREEScan for outdated or missing drivers - takes under a minuteDriver Scan →The main types of GPU bottleneck
1. Shader and arithmetic throughput
A shader or compute kernel can be limited by the instruction throughput of the GPU’s execution units. Common examples include complex pixel shaders, expensive post-processing, high-quality lighting, matrix-heavy compute, ray-tracing calculations, and algorithms that perform too many instructions per output.
In a game, symptoms may include a strong frame-time response when expensive effects are reduced, even if VRAM usage is modest. The appropriate fix is to reduce the amount or cost of the work: lower shader-heavy effects, simplify algorithms, reduce unnecessary passes, use an appropriate precision, or avoid calculating results that are not visible or needed.
For compute workloads, kernel timing and instruction-throughput counters are more useful than a board-level utilization percentage. An optimization that reduces instruction count is valuable only if instruction throughput is the actual limit; removing arithmetic from a memory-bound kernel may produce little improvement.
2. Memory bandwidth, latency, and cache behavior
A workload can spend more time moving data than processing it. Poorly coalesced memory accesses, cache misses, excessive global-memory traffic, texture or framebuffer bandwidth, and register spilling can all reduce effective throughput.
Free tools Windows power users keep installed
One-click scans. No signup required.
This is different from running out of VRAM. A game or application can fit all of its resources in video memory and still be limited by the rate at which the GPU can read and write them. Conversely, a system can have ample memory bandwidth but suffer stutter because resources do not remain resident in VRAM.
Rank #2

- PCIe 5.0 x16 Riser Cable Included: Built for the latest graphics cards, the included 165mm PCIe 5.0 riser cable supports high-speed data transfer, stable performance, and backward compatibility with PCIe 4.0 and older standards.
- Showcase Your Graphics Card: Mount your GPU vertically and turn it into the centerpiece of your PC build, creating a cleaner, more premium look through tempered glass side panels.
- Wide Case Compatibility: Designed for E-ATX, ATX, and Micro-ATX cases, with support for graphics cards of any length and up to three slots wide. A minimum of four PCI slots is required for installation.
- Tool-Less Position Adjustment: The modular bracket adjusts in two directions, allowing the GPU to move up to 65mm toward the front panel and 30mm toward the side panel for better clearance, spacing, and airflow.
- Heavy-Duty Steel Support with Easier Installation: Reinforced SGCC steel supports large graphics cards and helps reduce sagging or flex. Install the bracket first, then mount your GPU for a smoother setup.
The roofline model is a useful way to think about this trade-off. A workload’s attainable performance is bounded by either arithmetic throughput or memory bandwidth, depending on its arithmetic intensity—the amount of computation performed for each byte moved. If a kernel is already at its bandwidth ceiling, further arithmetic optimization will not solve the main problem. The relevant optimization may instead be better data layout, tiling, cache reuse, fewer transfers, or less unnecessary data movement.
For GPU compute, keeping intermediate data on the device, using fast memory effectively, and minimizing host-device transfers are recurring optimization priorities. For graphics, texture formats, render-target traffic, cache behavior, and effects that require multiple full-resolution passes can matter even when a simple utilization overlay cannot identify them.
3. Host-device transfers and launch overhead
A fast GPU does not guarantee a fast application. Repeatedly copying data between the CPU and GPU, launching many tiny kernels, or synchronizing after every operation can leave the GPU with too little useful work at a time.
This bottleneck often appears as intermittent or low GPU activity rather than a continuously saturated GPU. A system-wide trace can reveal copy operations, CPU gaps, API overhead, and synchronization points. Typical remedies include batching small transfers, reducing launch frequency, keeping intermediate data on the device, and overlapping data transfers with computation when the workload and API allow it.
For a game, the equivalent problem may be command-submission overhead or an engine that cannot build work quickly enough. The symptoms can resemble a CPU bottleneck, and the distinction requires timing evidence rather than a single utilization reading.
4. Insufficient parallelism and low occupancy
GPUs hide memory and instruction latency by keeping many warps or wavefronts active. If a kernel has too few threads, an undersized grid, excessive register use, large shared- or local-memory requirements, or unsuitable thread-block dimensions, too little work may be resident concurrently.
Occupancy describes how many warps or wavefronts can reside on an execution unit relative to the hardware’s maximum. It is useful evidence, but it is not a performance score. Higher occupancy is not automatically faster. A kernel with lower occupancy may perform well because its threads have more registers or enough instruction-level parallelism to hide latency. Forcing occupancy upward can also cause register spilling or reduce useful instruction-level parallelism.
Measure the kernel, inspect resource usage and occupancy, change one factor, and retest. Do not reduce register allocation or thread-block size simply to obtain a larger occupancy percentage.
5. CPU submission, synchronization, and game-engine limits
A powerful GPU can be underfed by the CPU or by the engine’s structure. Possible causes include a saturated game thread, driver or graphics-API overhead, asset streaming, shader compilation, thread synchronization, serial sections, blocked worker threads, or insufficient command generation.
Total CPU usage can be misleading. A game showing 40% overall CPU usage may still be CPU-bound if one important thread is saturated while the remaining cores are lightly used. Check per-thread or per-core behavior where possible, but also look for CPU-to-GPU timing gaps and synchronization events.
In a graphics trace, the important question is not “Is the CPU busy?” but “Is the GPU receiving enough useful work, and what is preventing it from receiving more?”
6. Power, thermal, and clock throttling
A GPU may be capable of more work but operate below its expected clocks because of a thermal limit, power limit, external power constraints, an application clock setting, or another enforced performance state. This is a different problem from an intrinsically demanding workload.
Rank #3

- 2 x 92mm fans combined into one interface, can be connected to the motherboard's 3-pin or 4-pin interface and you only need to access one interface to run all the fans
- This cooling fan's total size is 7.36in(L) x 4.72in(W) x 1.18in(H), designed for most universal graphic card video card VGA cooling,just please check the size to make sure your pc has enough space
- D-type interface cable included four interfaces, three voltages: 5V, 7V and 12V; different voltages with different airflow, speed and noise. You can select the appropriate voltage interface to start the fan
- The double ball bearing has a service life of 65,000 hours, and the 7 blades produce strong airflow to keep the computer case cool
- packing list: 2 x 92mm fans (PCI bracket screwed), 1 x multi-voltage cable ,1 x mini screwdriver,1 x fixing screw
Evidence for thermal throttling is not merely a high temperature. Look for a sustained clock reduction that coincides with a reported thermal slowdown reason. On NVIDIA hardware, nvidia-smi can expose performance state, clocks, power readings, temperature, and clock-event or slowdown reasons. For example:
nvidia-smi --query-gpu=utilization.gpu,clocks.sm,power.draw,temperature.gpu,pstate --format=csv -l 1For additional performance-limit information on supported drivers, inspect:
nvidia-smi -q -d PERFORMANCEThese commands apply to NVIDIA GPUs and their available fields can vary by driver and hardware. A power or thermal reason should be correlated with frame-time behavior. A hot card that maintains its expected clocks is not automatically throttling.
Do these 3 things before closing this tab:
1Fix the driver behind crashes, sound loss and screen glitches2Repair Windows errors before they cause bigger problems3Scan for outdated or missing drivers - takes under a minute7. VRAM capacity, paging, and residency
Insufficient VRAM can cause allocation failures, texture-quality changes, stutter, paging, and transfers between device memory and system memory. The most useful evidence is a combination of memory usage, frame-time behavior, and residency or paging events.
VRAM capacity and memory bandwidth are separate constraints:
- Capacity pressure: the application cannot keep all required resources resident in video memory, so it may page, stream, evict, or fail allocations.
- Bandwidth pressure: the resources fit in VRAM, but the GPU cannot move data quickly enough for the workload.
Adding a card with more VRAM can help the first problem. It does not directly fix shader throughput, memory bandwidth, CPU submission, synchronization, or low clocks. Memory-analysis tools such as PIX can show heap residency and paging, while system traces such as Nsight Systems can show GPU memory allocation activity.
A practical workflow for finding the bottleneck
Step 1: Choose the metric before changing settings
For games and graphics, measure frame time rather than relying only on average FPS. Record the average and the frame-time distribution, including meaningful percentiles or low-frame-rate behavior. A stable 60 FPS and a game that repeatedly falls from 120 to 40 FPS can have very different frame-time problems even if a short average looks acceptable.
Recommended Free Tools
For compute, choose kernel time, end-to-end latency, time-to-solution, or another metric that represents the actual goal. Include copy time, launch time, barriers, and synchronization when they contribute to the user-visible result.
Step 2: Establish a controlled baseline
Use the same scene, camera position, resolution, quality settings, input, application version, driver, power mode, and background conditions for each test. If the game has a built-in benchmark, use the same run every time. If it does not, create a repeatable route or scene.
Record the frame time, GPU utilization, GPU clock, temperature, power behavior, VRAM usage, and CPU behavior. A result from one scene or one brief spike is not necessarily representative of the game.
Step 3: Run the resolution-scaling test
Lower the rendering resolution or render scale while leaving the rest of the workload as consistent as possible.
Outdated Drivers Are Slowing You Down
One free scan finds every outdated or missing driver and matches the right update for your exact hardware.Free scan · exact hardware matchWindows Errors? Fix Them Before They Spread
Repair common Windows errors and clear accumulated junk for a smoother, more stable PC - no reinstall needed.Free scan · no reinstall- Frame rate rises substantially: the workload is GPU-sensitive. The GPU is likely contributing materially to the frame time, although this does not identify whether shaders, bandwidth, ray tracing, or another GPU resource is limiting.
- Frame rate barely changes: the CPU, engine, synchronization, frame cap, display path, or another non-resolution-sensitive limit may dominate.
- Frame rate improves only in certain scenes: the bottleneck is scene-dependent, which is common in games.
This is a controlled experiment, not proof of a particular hardware unit. Resolution changes the amount of pixel and often shader work, but it does not isolate every graphics cost.
Rank #4

- Double Protection: Asiahorse graphic card cooler is designed with 3 * 80mm fan blade and GPU brace support, can generate strong airflow to support cooling of the graphics card, while provides strong and long-lasting support to protect the motherboard from being damaged by the weight of graphics card.
- Quickly Cooling: Pwm fan control Function, allows dynamic speed adjustment between 800-3000 RPM, Noise level up to 25 DBA, minimizing noise or maximizing airflow.
- Swirl Blade Design: The gpu cooling fan adopts swirling fan structure to enhance and direct the airflow, with a maximum air pressure of 50CFM to provide better heat dissipation.
- Argb Led Frame Design: Built in 13 independent RGB LEDs in every fan, supporting 5V 3PIN ARGB motherboard SYNC, offering a variety of ARGB light effect mode to easily add vivid LED lighting to your system.
- Convenient Adjustment: Easy installtion, the support arm slides and locks in place to cool the graphics card directly in parallel or vertical with three high air flow RGB Fans, providing the easiest adjustment to allow you easily using various graphics card and PC case combinations.
Step 4: Change one expensive setting at a time
Test settings that correspond to different kinds of work. Lowering ray tracing primarily tests ray-tracing cost. Reducing shadow quality, volumetric effects, reflections, ambient effects, or post-processing may test different shader and bandwidth paths. Lowering texture quality is more likely to affect VRAM capacity and texture traffic than raw shader arithmetic.
Do not change resolution, textures, shadows, ray tracing, frame caps, and upscaling simultaneously if the goal is diagnosis. A large FPS change tells you that one or more settings matter; one-at-a-time tests help identify which ones.
Step 5: Check CPU timing, not just total CPU usage
Look for a saturated game or render thread, long submission gaps, blocked threads, driver/API overhead, asset-streaming work, shader compilation, and synchronization. If the GPU is idle while the CPU is preparing commands, the system is not being limited by the GPU’s ability to execute those commands.
For a more reliable answer, use a CPU/GPU timing trace. Nsight Systems is designed to show system-wide CPU and GPU activity, GPU starvation, low-utilization gaps, API calls, and synchronization-related behavior.
Step 6: Check clocks and operating limits
Compare the GPU clock during the slow section with its normal sustained clock under the same workload. Inspect temperature, power draw, performance state, and any reported thermal or power slowdown reason. If clocks are unexpectedly low, fix cooling, power delivery, fan control, or configuration before concluding that the GPU itself lacks rendering capacity.
Do not infer throttling from temperature alone. The relevant pattern is sustained lower performance correlated with an actual limiting reason.
Step 7: Check VRAM usage and residency behavior
Near-full VRAM usage is a warning sign, not a verdict. Some applications reserve memory aggressively without paging, while others may stutter before a simple monitoring tool reports a full allocation.
Look for texture or asset-quality changes, allocation failures, spikes in frame time, paging, evictions, or transfers involving system memory. If those events correlate with the stutter, reducing texture quality, resolution-dependent render targets, or other memory-heavy assets may help. If memory remains resident and frame time is stable, more VRAM is unlikely to solve the current limit.
Step 8: Profile the expensive work
Once a controlled test shows that the GPU is involved, determine which work consumes the time. For graphics, sort frame events or ranges by GPU duration. For compute, identify the longest kernels and the percentage of total time spent in kernels, copies, launches, barriers, and synchronization.
For developers, GPU profiling tools are more useful than a generic overlay when the broad resolution test is no longer enough. Choose the tool according to the API, hardware vendor, and workload:
- NVIDIA graphics: Nsight Systems provides system-wide CPU/GPU timing, API activity, gaps, and synchronization context. Nsight Graphics GPU Trace provides GPU-unit utilization, shader performance, occupancy information, and graphics-pipeline bottleneck analysis.
- NVIDIA CUDA compute: Nsight Compute and CUDA profiling guidance provide kernel-level analysis of instruction throughput, memory behavior, occupancy, and related performance counters.
- AMD ROCm/HIP compute:
rocprofcan capture API and activity traces, kernel execution, asynchronous copies, barriers, performance counters, and hardware traces. - DirectX 12 on Windows: PIX for Windows supports GPU captures and timing captures, CPU/GPU work inspection, memory and residency analysis, paging information, pipeline inspection, and supported hardware counters on AMD, Intel, and NVIDIA GPUs.
These are official vendor or platform development tools, and their API, hardware, operating-system, and driver support should be checked before use. They are not interchangeable: a DirectX 12 graphics capture and a CUDA kernel profile answer different questions.
Step 9: Change one variable and retest
Use the evidence to choose an intervention, then change one variable. Examples include reducing a costly graphics effect, changing a compute kernel’s data layout, batching transfers, reducing synchronization, altering tiling, or testing a resource-allocation change.
Best Value
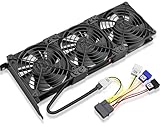
- Package include: 1 Piece Graphic Card Fans ( 3-Fans connected ) with 1*Power D-type Interface cable
- Dimension: 92mm(L) x 92mm(W) x 25mm(H) / 3.62in(L) x 3.62in(W) x 1in(H) in per fan. Totally Size: 276mm(L) x 120mm(W) x 30mm(H) / 10.86in(L) x 4.72in(W) x 1.18in(H)
- Rated Voltage: DC 12V; Rated Current: 0.45Amp; Rated Speed: 3x 1800 RPM; Air flow: 3x 39.8 CFM; Noise: 3x 24.8 dBA
- D-type interface cable included four interfaces, three voltages: 5V 7V and 12V; Different voltages with different airflow, speed, and noise. you can select the appropriate voltage interface to start the fan.
- 3 fans combined into one interface, Can be connected to the motherboard's 3-pin or 4-pin interface and you only need to access one interface to run all the fans.
An optimization is credible only if it improves the chosen metric on a representative workload. A higher utilization percentage is not itself an improvement, and a faster isolated kernel may not improve end-to-end application time if copies or synchronization dominate.
Step 10: Validate in the live application
Capture and replay tools are essential for detailed analysis, but replay may not reproduce the original CPU pacing or every frame-to-frame behavior. A replay can also reflect the replay GPU and driver rather than the exact live environment.
After changing the code or settings, test the real application with the original workload. Confirm both average performance and frame-time consistency, and check that a fix in one scene has not simply moved the bottleneck to another.
Free tools Windows power users keep installed
One-click scans. No signup required.
How to interpret common observations
| Observation | What it suggests | Next test |
|---|---|---|
| GPU utilization is high and lowering resolution increases FPS | The workload is GPU-sensitive, but the exact subsystem is still unknown. | Test expensive effects separately and profile shader, texture, raster, ray-tracing, and memory activity. |
| GPU utilization is high but clocks are unexpectedly low | Power, thermal, external-power, application-clock, or another performance limit may be restricting throughput. | Compare clocks and frame time, then inspect reported slowdown reasons. |
| GPU utilization is low and frame rate is low | The CPU, submission path, synchronization, frame cap, short bursts, or a specialized engine may be limiting performance. | Inspect CPU/GPU timing rather than assuming the GPU is free of bottlenecks. |
| Total CPU usage is moderate but frame rate does not improve at lower resolution | A single saturated game or render thread may be hidden by idle CPU cores. | Inspect per-thread behavior and CPU-to-GPU submission gaps. |
| VRAM is nearly full and frame times spike during asset changes | Capacity pressure, paging, or residency churn is plausible. | Check residency and paging events, then test lower texture or memory-heavy settings. |
| VRAM usage is low but GPU time remains high | Shader arithmetic, rasterization, ray tracing, bandwidth, or another execution resource may be limiting. | Use GPU timing and hardware counters; do not buy more VRAM based on this result. |
| Changing resolution has little effect, but reducing CPU-heavy scene complexity helps | The engine or CPU submission path is likely dominant. | Profile the game thread, draw-call submission, synchronization, and serial work. |
| Occupancy is low | Resource use or insufficient parallelism may be limiting latency hiding, but low occupancy may be intentional and efficient. | Compare kernel time, register use, shared/local memory, and instruction-level parallelism before changing it. |
Which fix matches which bottleneck?
| Evidence-based diagnosis | Likely useful response | What it will not fix |
|---|---|---|
| Shader or arithmetic throughput | Reduce shader complexity, expensive effects, instruction count, or unnecessary passes; use suitable precision where correct. | CPU submission gaps or VRAM paging. |
| Memory bandwidth or cache behavior | Improve access patterns, coalescing, tiling, cache reuse, data layout, and traffic volume. | A CPU-limited game thread or a card that is thermally throttling. |
| Host-device transfers or launch overhead | Batch small operations, keep intermediate data on the device, reduce launch frequency, and overlap copies with computation. | A shader that is simply too expensive once the GPU is fed. |
| Insufficient parallelism or resource-limited occupancy | Adjust grid and block or wave configuration, resource use, and memory requirements, then benchmark each change. | Any problem where more occupancy does not improve the critical kernel. |
| CPU submission or synchronization | Reduce serial work and unnecessary synchronization, improve command generation, address asset-streaming or compilation stalls, and optimize the limiting thread. | Raw GPU shader throughput when the GPU is already continuously busy. |
| Power or thermal throttling | Correct cooling, airflow, power, fan, or configuration problems and verify sustained clocks under load. | A workload that remains too demanding after the GPU reaches its expected clocks. |
| VRAM capacity and residency | Reduce memory pressure, improve streaming and residency behavior, or choose hardware with more capacity when the evidence supports it. | Memory-bandwidth limits, shader cost, CPU limits, or synchronization. |
When should you upgrade the GPU?
A GPU upgrade is the logical response when a representative workload remains GPU-sensitive after basic configuration and thermal checks: lowering resolution or GPU-heavy settings produces a meaningful frame-time improvement, clocks are behaving normally, and profiling shows sustained GPU work rather than CPU or synchronization gaps.
A faster GPU is less likely to help when lowering resolution barely changes frame rate, the GPU spends substantial time idle waiting for the CPU, one game thread is saturated, or frame-time spikes come from asset streaming and synchronization. In those cases, a faster CPU, engine optimization, storage or streaming fix, configuration change, or application update may be more relevant.
Choose more VRAM only when capacity pressure, paging, or residency is the problem. Choose more memory bandwidth or shader performance when the workload is limited by those resources. These are different upgrade requirements, and a product’s total VRAM number cannot identify the correct one by itself.
Also remember that fixing one bottleneck can expose another. Lowering resolution may move a game from GPU-bound to CPU-bound. Improving a kernel’s arithmetic throughput may reveal a memory-transfer limit. Raising GPU clocks may expose a synchronization gap. Re-run the measurements after every meaningful change.
Recommended Free Tools
Common misconceptions
“Low GPU utilization means the GPU is not the bottleneck.”
Not necessarily. A particular GPU engine may be limiting performance, activity may occur in short bursts, or the workload may be stalled by synchronization or memory behavior. Use a trace and frame-time correlation.
“High GPU utilization proves the GPU core is the bottleneck.”
No. High aggregate utilization can include memory, texture, copy, or other active work. It does not identify the saturated subsystem.
“The CPU is only at 40%, so the game cannot be CPU-bound.”
Total CPU utilization averages across cores. One saturated game or application thread can limit command generation while other cores remain idle.
“Higher occupancy is always faster.”
No. Occupancy must be balanced against register use, memory requirements, instruction-level parallelism, and actual kernel timing. Higher occupancy can sometimes make a kernel slower.
The Tool Desk
Outbyte Driver Updater FREEScan for outdated or missing drivers - takes under a minuteDriver Scan →Outbyte PC Repair FREEClear out junk files and repair common Windows errorsFree Scan →“More VRAM automatically fixes performance.”
More capacity helps when the application is paging or struggling to keep resources resident. It does not directly repair shader throughput, memory bandwidth, CPU submission, synchronization, or thermal throttling.
“A bottleneck is permanent.”
Bottleneck identity changes with resolution, settings, scene, batch size, algorithm, driver, clocks, and hardware. Diagnose the workload you actually want to improve, not a generic system percentage.
The Bottom Line
The right question is not “Is my GPU at 99%?” but “Which stage is consuming the frame-time budget, and why?” Start with a controlled resolution and settings test, verify CPU and GPU timing, check clocks and VRAM behavior, then profile the expensive work. Only after that should you choose an optimization or hardware upgrade.
Quick Recap
Product prices and availability are accurate as of the date/time indicated and are subject to change. Any price and availability information displayed on Amazon at the time of purchase will apply.
Do these 3 things before closing this tab:
1Scan for outdated or missing drivers - takes under a minute2Repair Windows errors before they cause bigger problems3Fix the driver behind crashes, sound loss and screen glitches



