What’s actually slowing this PC down?
Pick the symptom - the matching free tool is one click away.
A sudden FPS drop usually means that one part of the frame-rendering pipeline has temporarily become a bottleneck—or stopped delivering work on time. The cause may be thermal throttling, a CPU or GPU limit, full VRAM or RAM, shader compilation, asset streaming, a driver issue, background software, or a game-specific bug.
Before changing random graphics settings, watch frametime, CPU and GPU usage, temperatures, clock speeds, memory, disk activity, and network statistics while the drop happens. That evidence usually identifies whether the problem is rendering performance, frame pacing, or internet lag.
As an Amazon Associate I earn from qualifying purchases.
First: Is It an FPS Drop or Internet Lag?
“Lag” is often used for every kind of poor game performance, but FPS and network problems feel different—and require different fixes. You can also experience both at the same time.
| True FPS problem | Network problem |
|---|---|
| The image becomes visibly slow or choppy. | Other players freeze, teleport, or rubber-band. |
| The local FPS counter falls. | FPS may remain normal while inputs arrive late. |
| Frametime spikes or becomes uneven. | Ping or packet loss spikes, often with a network warning icon. |
| It may also happen offline or in single-player. | It mainly affects online interactions and server response. |
If the FPS counter and frametime graph stay stable but players teleport or actions are delayed, investigate your connection, server, or network route—not your graphics card. If a crowded online match also makes the game stutter locally, both CPU load and network congestion may be involved.
#1 Best Overall

- 【Turbine Heat-Absorbing Fan】This video cards cooling fan uses a suction turbo fan. The turbo fan rotates to suck the waste heat stuck near the board, and then quickly dissipates heat through the I/O panel on the side, which can directly accelerate the temperature adjustment around the board.
- 【Double Plug Design】This computer cooling fan has a large 4P power connector with two sets of plugs, which can be directly connected to the power socket of the chassis, and the dual-plug design can provide another connector when using one power connector, which does not occupy limited power interface.
- 【A Variety Of Functions】Our chassis cooling fan is compact and versatile. It can cool the processor and memory and can also be used to cool the graphics card. Moreover, since the general chassis has 7 PCI slots, you don't have to worry about installing a heat sink, and it is easy to install and maintain.
- 【Efficient Heat Dissipation】Our PCI cooling fan has high air volume and high static pressure. High-quality heat dissipation performance. It can be installed in almost all expansion slots and direct airflow to PCI fans that require more functions.
- 【100% Guarantee】Our cooling fan size is 111*90*21mm.If you have any questions about our products while using them, please feel to our 24/7 customer service, we will provide a professional assistant for you.
What the Timing of the Drop Reveals
Pay attention to when the problem begins. “Suddenly” is a useful diagnostic clue.
| When it happens | Likely explanations |
|---|---|
| Immediately after launch | Wrong GPU, power-saving mode, shader preparation, or driver problem. |
| After 10–30 minutes | Heat buildup, thermal throttling, laptop power limits, dust, or fan problems. |
| When entering a new area | Shader compilation, asset streaming, storage latency, or a CPU spike. |
| At regular intervals | Background scans, cloud synchronization, overlays, telemetry, or thermal cycling. |
| During explosions or crowded scenes | GPU load, CPU simulation, particles, ray tracing, VRAM pressure, or engine limits. |
| After a game or driver update | Shader-cache rebuilding, changed settings, a driver regression, or a game patch. |
| Only on laptop battery | Battery limits, an OEM power profile, or integrated-GPU use. |
| In every game | System-wide driver, thermal, power, Windows, background-process, or hardware trouble. |
| In one game only | A title-specific setting, patch, shader cache, engine limitation, or configuration. |
The Fastest Way to Diagnose a Sudden FPS Drop
Monitor more than the FPS number
Average FPS can hide the problem. A game averaging 120 FPS can still feel bad if one frame takes much longer than the next. Frametime—the time required to render each frame—is often more revealing than the headline FPS counter.
Monitor these values before and during the drop:
- FPS and the frametime graph.
- GPU utilization, temperature, hotspot temperature where available, clock speed, power draw or power-limit flags, and dedicated VRAM.
- Total CPU usage, per-core or per-thread usage, CPU temperature, and effective clock speed.
- System RAM usage and committed memory.
- Disk usage and active time.
- Ping and packet loss for online games.
Windows Task Manager is enough for an initial check. Press Ctrl + Shift + Esc, then use Processes to sort by CPU, Memory, GPU, or Disk. The Performance tab shows component activity. If switching out of the game makes the problem disappear, use an in-game overlay or sensor logger instead.
HWiNFO is useful for detailed sensor logging. MSI Afterburner can place hardware statistics and frametime information over the game; download it only from MSI or Guru3D because fake download sites exist. Radeon users can also use the metrics and driver controls in AMD Software: Adrenalin Edition.
Make the reproduction repeatable
Use the same game mode, map or area, graphics preset, resolution, and camera route. Record the normal values, reproduce the drop, and compare the two moments. Change one variable at a time; otherwise you will not know which change helped.
Read the Telemetry: What Each Pattern Means
GPU usage is near 95–100%
High GPU usage is not automatically bad. It is normal when the GPU is the intended bottleneck. It becomes a problem when the scene demands more than the card can deliver, VRAM is nearly full, or temperature or power limits force the clock down.
Test, in this order:
- Lower resolution or render scale.
- Disable ray tracing.
- Reduce shadows, volumetric effects, reflections, and crowd density.
- Reduce texture quality only when VRAM is close to its limit.
- Compare GPU temperature and clock speed during the drop.
- Try a frame cap below the system’s normal maximum.
Resolution, fill-rate demands, pixel-shader work, and graphics-card limitations are common GPU-bound causes, as described in Microsoft’s Windows title performance guidance.
Rank #2

- Fan Diameter: 85mm , Mounting screw holes distance: 40mm * 40mm * 40mm, can work for many Graphic Card as a DIY fan , please check the fan size from your own Graphic Card
- Suitable for MSI GTX 1050/1060 Hurricane GPU
- Suitable for PNY GTX1070 as DIY fan
- Please keep the screw from your fan , we sell the fan not include any screw
GPU usage falls while one CPU thread is saturated
A total CPU reading of 40–60% does not rule out a CPU bottleneck. Games may depend on one heavily loaded thread for rendering submission, physics, AI, simulation, or asset streaming while other cores remain relatively idle.
Lower view distance, crowd density, foliage, simulation, and physics settings. Close browsers, recording software, RGB utilities, launchers, and hardware-control tools. Check per-core usage and effective CPU clocks, then test the same location repeatedly. A frame cap can also reduce CPU demand and improve consistency.
Temperature rises, then clocks and FPS fall
This pattern strongly suggests thermal or power management. Possible causes include blocked vents, dust, poor case airflow, a failed fan, dried thermal interface material, a silent laptop profile, high ambient temperature, or an unstable overclock or undervolt.
Check CPU temperature, GPU core and hotspot temperature where available, clock speed, and thermal- or power-limit indicators. There is no universal “safe” temperature for every processor or laptop: limits vary by component, firmware, sensor, and design. The important evidence is a repeatable relationship between rising temperature, falling clocks, and falling FPS. Intel’s FPS troubleshooting guidance explains that temperatures beyond a processor’s specifications can trigger throttling.
Recommended Free Tools
Improve airflow, clean vents safely, verify that fans operate, and remove aggressive overclocking while diagnosing. Temporarily testing a desktop with its side panel removed can reveal an airflow problem, but it is not a permanent cooling solution.
CPU and GPU usage both fall
This often means the game is waiting rather than running out of rendering capacity. Suspects include shader compilation, asset or shader streaming, storage stalls, memory paging, a driver recovery, a background interruption, a power transition, or a game-engine synchronization problem.
Check disk active time and read activity. See whether the hitch occurs in the same location or after the same action. Allow first-run shader processing to finish, restart the game, disable overlays and recording hooks, and check Windows logs for display-driver or hardware errors. If the game offers another graphics API, such as DirectX 11 instead of DirectX 12, compare them as a controlled test.
Rank #3

- High Airflow PCI Slot Cooling Fan: Our compact blower fan is designed to fit into a standard PCI slot, providing targeted cooling for expansion cards like video cards to avoid overheating and enhance system stability
- Dual Power Connector Design: Features a large 4-pin connector with dual plugs, allowing you to connect directly to the chassis power without occupying additional limited power interfaces for a clean and effortless setup
- High Static Pressure Performance: Engineered for high static pressure, this fan efficiently pushes air through tight spaces and heatsinks, delivering excellent thermal performance for your key components
- Quiet Run at 20 Decibels: Operates at a low noise level of only 20 decibels, ensuring effective cooling without disrupting your work or the serenity of your work space
- Complete Package for Easy Installation: You will receive 1pc 4.37 x 3.54 x 0.82 inch cooling fan ready for installation, with a wire length of 18 centimeters for flexible routing within your computer case
Shader compilation is a known source of PC gaming stutter, particularly in modern Direct3D 12 games. Microsoft discusses shader-cache delivery in its Advanced Shader Delivery overview and its GDC 2026 update.
The Tool Desk
Outbyte Driver Updater FREEScan for outdated or missing drivers - takes under a minuteDriver Scan →Outbyte PC Repair FREEClear out junk files and repair common Windows errorsFree Scan →VRAM or RAM is nearly full
Memory pressure can cause asset streaming delays, paging, and long frame times when data moves between VRAM, system RAM, and storage.
- If VRAM is the limiting resource, lower texture quality and texture-streaming distance.
- If system RAM is constrained, close browsers, launchers, and other memory-heavy applications.
- Check committed memory and paging activity rather than assuming that more RAM always increases FPS.
Additional RAM mainly helps when the current amount is insufficient or Windows is paging heavily.
Common Causes That Appear After Updates
Graphics-driver installation
A driver update can fix a game-specific bug, reset a profile, introduce a regression, or invalidate a shader cache. It can also cause temporary stutter while shaders are processed. Intel documents this post-installation behavior in its support guidance.
- Restart the PC.
- Launch the game and allow shader preparation to finish.
- Test with overlays disabled.
- Check the game’s patch notes and the GPU vendor’s release notes.
- If the issue clearly began with the update, test a known-good previous driver.
- Use a clean driver installation only if ordinary reinstall or rollback does not help.
Do not delete shader caches as a universal “FPS fix.” It can force compilation again and temporarily make stutter worse.
Game patches
If only one title changed, compare another game, the same title’s available graphics APIs, official patch notes, and reports from other players. Check whether settings were reset or shader preparation began again before assuming that hardware has failed.
Power Modes, GPU Selection, and Display Features
Laptop power and GPU selection
Gaming on battery, using an underpowered adapter, or running a game on integrated graphics can cause immediate or delayed drops. Plug in the laptop and check its manufacturer performance mode, battery status, hybrid-graphics routing, and refresh rate.
Rank #4
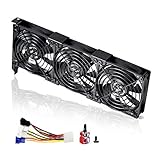
- 3 x 92mm fans combined into one interface, can be connected to the motherboard's 3-pin or 4-pin interface and you only need to access one interface to run all the fans
- This cooling fan's total size is 11in(L) x 4.72in(W) x 1.18in(H), designed for most universal graphic card video card VGA cooling,just please check the size to make sure your pc has enough space
- D-type interface cable included four interfaces, three voltages: 5V, 7V and 12V; different voltages with different airflow, speed and noise. You can select the appropriate voltage interface to start the fan
- The double ball bearing has a service life of 65,000 hours, and the 7 blades produce strong airflow to keep the computer case cool
- packing list: 3 x 92mm fans (PCI bracket screwed), 1 x multi-voltage cable ,1 x mini screwdriver,1 x fixing screw
In Windows 11, assign the game to the dedicated GPU through Settings → System → Display → Graphics → select the game → Options → High performance → Save. Restart the game afterward. Microsoft also documents GPU assignment and windowed-game optimization.
For a diagnostic test, use Settings → System → Power & battery → Power mode → Best performance. Microsoft notes that this uses more power and may make the laptop warmer. It is not always the best permanent setting: extra power can worsen thermal throttling on an inadequately cooled laptop.
Free tools Windows power users keep installed
One-click scans. No signup required.
FPS caps, V-Sync, VRR, and frame generation
A changing frame rate is not automatically a fault. The game, driver, V-Sync, variable refresh rate, battery profile, dynamic resolution, or frame-generation mode may intentionally limit or alter output.
- Check the in-game FPS limit.
- Check the GPU control-panel profile for the game.
- Confirm the monitor’s refresh rate in Windows.
- Record whether the game uses exclusive fullscreen, borderless, or windowed mode.
- Temporarily disable frame generation to see whether the base render rate is stable.
- Re-enable features one at a time.
Do not assume disabling V-Sync always improves performance. It can increase tearing, and the best synchronization setup depends on the display, frame rate, VRR range, game, and latency priorities.
Fixes in the Safest Order
- Restart and reproduce. Record whether the issue appears immediately or only after heat builds.
- Close unnecessary software. Use Task Manager to identify CPU, GPU, memory, or disk consumers. Microsoft also recommends reviewing Task Manager → Startup apps for unnecessary launch-on-boot programs; see its performance guidance.
- Plug in laptops and verify GPU assignment. Check the adapter, OEM performance mode, Windows power mode, and dedicated-GPU setting.
- Disable overlays and recording temporarily. Test game overlays, chat overlays, browser overlays, capture tools, RGB utilities, and streaming software.
- Check temperatures, clocks, and airflow. Remove overclocking or undervolting while testing.
- Change the setting matching the measured bottleneck. Use resolution and ray-tracing changes for a GPU limit; view distance and simulation changes for a CPU limit; textures for VRAM pressure.
- Verify game files. A damaged or incomplete installation can create title-specific failures.
- Update or roll back the driver based on timing. The newest driver is not automatically the best choice for every game.
- Test shader behavior and another graphics API. Allow shader processing to finish before judging a fresh driver or game installation.
- Perform deeper diagnostics. Use Reliability Monitor, Event Viewer, hardware tests, a clean boot, or a minimal startup environment for persistent problems.
Optional Windows Diagnostics
These commands help establish a timeline; they do not prove that every logged warning caused the FPS drop.
perfmon /relOpens Reliability Monitor, where you can check whether application or driver failures began with the performance problem.
Do these 3 things before closing this tab:
1Repair Windows errors before they cause bigger problems2Fix the driver behind crashes, sound loss and screen glitches3Clear out junk files and repair common Windows errorseventvwr.mscOpens Event Viewer. Check Windows Logs → System for display-driver resets, hardware errors, and power events.
Best Value

- Powered by Radeon AI PRO R9700 - Supercharge you workflow with the cutting-edge RDNA 4 Architecture and 2nd-gen AI Accelerators.
- 32GB GDDR6 with 256-bit memory bus - Tackle larger, more complex projects without limits.
- PCIe Gen 5 - Unlock lightning-fast data transfers with PCIe Gen 5 support.
- GIGABYTE TURBO Fan Cooling System - Indented metal cover and blower fan increase airflow intake, while the vapor chamber, all copper heat sink, and metal frame offer efficient heat dissipation. Optimized airflow design allows for easy multi-GPU scalability.
- Double Ball Bearing Fan - Delivers superior heat resistance and rotational efficiency for better performance and a longer lifespan compared to conventional sleeve fans.
dxdiagOpens DirectX Diagnostic Tool and provides system and graphics-driver information.
Laptop-Specific Checks
- Use the intended AC adapter and confirm that the battery is not forcing a restricted mode.
- Check the manufacturer’s silent, balanced, and performance profiles.
- Confirm that the game uses the discrete GPU.
- Compare the internal display with an external monitor to identify hybrid-graphics or refresh-rate behavior.
- Inspect vents and fans, remembering that Best performance can increase heat.
- Check internal and external refresh-rate settings and whether the game is running in borderless mode.
When to Suspect Hardware
Hardware deserves closer testing when every game shows the same behavior, clocks fall abnormally, temperatures behave unexpectedly, or the system also crashes, displays artifacts, or reports display-driver resets. The same applies when a GPU, CPU, RAM, or storage stress test reproduces the problem, or when the issue began after a component, BIOS, or power-supply change.
After a clean driver installation and a minimal startup environment, persistent system-wide symptoms are stronger evidence of hardware, cooling, power delivery, firmware, or Windows configuration than of one game’s settings. Check component specifications and manufacturer diagnostics rather than relying on universal temperature thresholds.
Quick wins for a faster PC:
Repair Windows errors before they cause bigger problemsFix Now →Fix the driver behind crashes, sound loss and screen glitchesFind Drivers →Should You Lower Settings or Upgrade?
Lower settings first when the GPU is consistently saturated, the drop happens in demanding scenes, VRAM is nearly full, and lowering resolution produces a clear improvement. Reduce ray tracing, resolution, shadows, volumetrics, and reflections before buying hardware.
Investigate the rest of the system first when GPU usage is unexpectedly low, the issue affects every title, clocks or temperatures change abnormally, a background process appears, or the problem began after an update. A new GPU will not fix a CPU-thread bottleneck, shader compilation, thermal throttling, a bad driver, a failing SSD, or network lag.
A frame cap is also worth testing. It may lower peak FPS while improving frame pacing, heat, power use, and fan noise. The appropriate cap depends on your display refresh rate, VRR range, engine, and input-latency priorities.
What Not to Do
- Do not install registry cleaners, “one-click FPS boosters,” driver-updater aggregators, or unverified debloaters.
- Do not make several BIOS, driver, and graphics changes at once.
- Do not overclock or undervolt before the cause is understood; instability can create intermittent drops, crashes, and corrupted sessions.
- Do not delete shader caches without a specific reason.
- Do not reinstall Windows for a single-game shader, patch, or graphics-setting problem.
- Do not treat 100% GPU usage as inherently bad or low GPU usage as proof of a defective GPU.
The Practical Diagnosis
The useful question is not simply “What FPS do I get?” It is “What changed at the exact moment the frametime spiked?” High GPU usage points toward rendering load; low GPU usage with a saturated game thread points toward the CPU or engine; rising temperatures followed by falling clocks point toward thermal or power limits; full memory or active storage points toward streaming or paging; and stable FPS with teleporting players points toward the network.
Keep the telemetry that confirmed or disproved your theory, make one change at a time, and retest the same scene. That approach is faster—and less destructive—than randomly lowering every setting or buying a component before identifying the bottleneck.
Quick Recap
Product prices and availability are accurate as of the date/time indicated and are subject to change. Any price and availability information displayed on Amazon at the time of purchase will apply.




