
A Steam chart can show that more people were playing at a particular moment, but it cannot by itself prove that a game sold more copies or entered a lasting growth phase. To read one correctly, identify the metric, chart provider and time window first; then look for repeated movement above the game’s normal level and check launches, updates, discounts and other events that overlap the dates.
The practical rule is simple: treat a peak as an observation, not a conclusion. A durable trend requires a sustained change in typical activity across comparable measurements, while a sales ranking is a different signal from concurrent players.
As an Amazon Associate I earn from qualifying purchases.
Identify exactly what the chart measures
People often use “Steam player count” to describe several different measurements. Those measurements answer different questions, so combining them in one argument can create a false story about demand.
Free tools Windows power users keep installed
One-click scans. No signup required.
Concurrent players right now
Concurrent players, usually abbreviated CCU, are the number of people playing simultaneously at a moment or during a short polling interval. It is a snapshot of activity on Steam, not a count of unique players over a day, copies sold, or revenue. A game can have a high CCU because a relatively small group plays for long sessions, while a game with many brief sessions may show a lower simultaneous count.
#1 Best Overall

- BLUE LIGHT BLOCKING GLASSES: Our blue light glasses for women boast UV400 protection, blocking harmful blue rays from computer screens. With these bluelight glasses women, you can enjoy gaming, reading, or watching TV with no worries of eye strain.
- EYE RELIEF: Our blue light glasses are engineered to reduce blurry vision or strain caused by prolonged screen time. These womens blue light glasses aid in better sleep by preventing blue light from disrupting your natural sleep cycle, helping you fall asleep faster and enjoy a more restful night's sleep, making them the perfect christmas present.
- COMFORTABLE: Crafted from durable material, our trendy blue light glasses for woman or blue light glasses men ensure long-lasting comfort. The high-transmittance lenses accessories, gamer gifts for men, help keep your eyes relaxed. Perfect stocking stuffers, gifts for gamers men, christmas gifts for men, halloween costumes.
- LIGHTWEIGHT: These clear blue light glasses feature a lightweight frame, meaning they’ll stay comfy for long-term wear. Perfect as blue blockers glasses for women or mens blue light glasses, these non-prescription fake glasses for men can be worn throughout the day. The blue light blocking glasses women feature polycarbonate HD lenses, which are anti-reflective and restore true color.
- WORRY-FREE PURCHASE: If you experience any issues, our support team is ready to assist you quickly. These are the perfect costume glasses for cosplay dressing up.
Daily or historical peak
A daily peak is the highest concurrent value recorded during a day. A historical chart may connect those peaks or other observations over weeks or months. The highest point tells you when activity was most concentrated; it does not tell you how long the level lasted or what the typical level was before and after it.
Sales rank
A sales chart or store ranking orders products by a sales-related signal. It is not interchangeable with a CCU chart. Rank is relative to other products and can move when competing titles move, even if a game’s own sales are steady. Public rankings also do not disclose the units or revenue behind a position.
Average or typical activity
Some views provide averages or enough points to estimate a typical level. This is more useful for trend analysis than a single maximum because it shows whether the game spent substantial time at the new level. Always read the legend and units before drawing a conclusion.
Recommended Free Tools
| Chart label | What it can tell you | What it cannot establish |
|---|---|---|
| Current concurrent players | How many Steam users were playing simultaneously at the observation time | Daily unique users, sales, revenue or long-term direction |
| Daily peak concurrent players | The busiest recorded moment in each day | How long the peak lasted or the day’s typical activity |
| Historical concurrent series | Whether observed simultaneous activity rose, fell or returned toward a baseline over a selected period | The reason for each movement or activity on other platforms |
| Sales ranking | How a product’s sales signal compares with other products in that ranking at that time | Exact units, revenue, conversion rate or a game-specific CCU trend |
Why a peak is not automatically a trend
A trend is a repeated change in the level you normally observe. One tall bar can be a launch-hour rush, a weekend session, a streamer-driven burst, a discount response or a short technical event. If the next observations return to the previous range, the evidence supports a spike rather than a lasting shift.
Use a baseline
Choose a baseline that matches the question: the preceding several weeks for a post-update analysis, comparable weekdays for a time-of-week question, or the pre-sale period for a promotion analysis. Do not compare a Saturday evening peak with a Tuesday morning count and call the difference growth.
Look for persistence and repetition
Ask whether elevated values continue after the suspected event and whether similar highs recur on later days. A trend normally appears as a sustained change in typical levels, not merely a new maximum. If only the maximum rises while the median-looking part of the series is unchanged, describe a higher peak, not durable growth.
Keep the observation window honest
Short windows magnify launch and event bursts. Longer windows show whether attention persisted or drifted back toward the old baseline. State the exact dates and window whenever you publish a chart interpretation so readers can see what was included and excluded.
What’s actually slowing this PC down?
Pick the symptom - the matching free tool is one click away.
Understand how the chart provider collected the data
Two public sites can display different values for the same game without either one intentionally changing the history. Their polling schedules and collection methods differ.
Rank #2
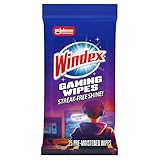
- WINDEX GAMING WIPES: effortlessly clean all your gaming gear and gaming electronics in one easy step with our new Windex Gaming Wipes
- AMMONIA FREE: our ammonia-free formula is safe to use on all of your favorite gaming equipment like consoles, headsets, controllers, screens, keyboards, and more
- PRE-MOISTENED WIPES: each wipe instantly removes dust, dirt, and stubborn smudges and fingerprints leaving a streak-free shine
- ANTI-STATIC: great for cleaning and wiping down your gaming gear and electronics leaving behind no visible residue
- COMPACT RESEALABLE PACKAGE: store your pack of Windex Gaming Wipes anywhere in your home for whenever a quick and easy wipedown is needed
SteamDB
SteamDB says its current player counts come directly from Steam’s API. It reports refreshing the current top 800 games every five minutes and other games every ten minutes. Those intervals can capture a brief burst differently depending on when a burst begins and ends. SteamDB also states that its data is provided as-is, without warranties or guarantees of accuracy, completeness or timeliness; treat the method as the site’s description, not as an independently audited measurement. See the SteamDB FAQ for its cadence, API and limitations.
Steam Charts
Steam Charts describes hourly queries across the catalog, with collection extending back to July 2012. Hourly sampling can miss a short-lived high that a more frequent poll catches, or record it at a different point in the hour. Its stated method is documented on the Steam Charts About page.
How cadence changes interpretation
Do not splice a five-minute-refresh series and an hourly series into one continuous measurement without labeling the change. When comparing providers, use the same game, metric, date range and provider, and explain that different sampling cadences may produce different maxima. Historical completeness is not guaranteed merely because a chart has a long time axis.
A step-by-step method for reading any Steam chart
- Read the title, legend and units. Identify whether the line is current CCU, a daily peak, an average, a historical concurrent series or a sales ranking. Record whether values are counts, percentages or rank positions.
- Write down the source. Note the provider and link before interpreting the line. A SteamDB series and a Steam Charts series may use different polling schedules.
- Set the time window. Record the first and last date, and whether the view shows hours, days, weeks or months. Expand the window when a short view makes a launch burst look like a permanent change.
- Find the pre-event baseline. Compare several observations before the suspected event, using equivalent days and times where possible. A baseline gives the peak a scale instead of letting the tallest point dominate the story.
- Mark known dates. Place launch, full release from Early Access, major updates, free weekends, seasonal sales and price changes on the same timeline. Use announcements and price history for the specific title rather than assuming an event occurred.
- Check persistence. Examine the observations after the event. Count how many comparable periods remain above baseline and whether the usual level changed, not just the maximum.
- Check repetition and timing. Look for repeated peaks at similar times of week and day. A regular weekend pattern is different from a one-off burst that begins immediately after a patch.
- Choose cautious language. Say “the peak coincided with the update” when the dates overlap. Use “caused” only when you have evidence that rules out plausible alternatives.
- Separate metrics in the conclusion. Report CCU findings as CCU findings and sales-rank findings as sales-rank findings. Do not turn either one into an estimate of units or revenue without a separate, explicitly justified method.
- State the platform scope. A Steam chart covers activity observed on Steam. It says nothing about console stores, another PC launcher or offline play unless those data are supplied separately.
Investigate what might have created a spike
Several events can produce a sudden increase. They are candidate explanations to test against dates and announcements, not universal causes.
Launch or full release
A new launch concentrates first-time interest into a short period. A title leaving Early Access can create a second burst because existing owners return and new buyers arrive. A launch peak is expected to be front-loaded; judge the post-launch baseline separately.
Major update or new content
Large patches, expansions and seasonal content can bring owners back. Check the update announcement, the size and timing of the patch, and whether elevated activity continues after players have tried the new material. A one-day patch spike and a month-long rise are different outcomes.
Discount or seasonal sale
Valve’s Seasonal Sales documentation says seasonal sale events run four times a year. It also says a discount of at least 20% automatically triggers email notifications to wishlisters and makes discounted games eligible for various Specials sections. These mechanisms can increase visibility and visits, but an overlapping peak still does not prove that the discount alone caused it. SteamDB notes that publishers choose their discounts and that it cannot know future participation or title-specific prices in advance.
Do these 3 things before closing this tab:
1Scan for outdated or missing drivers - takes under a minute2Repair Windows errors before they cause bigger problems3Fix the driver behind crashes, sound loss and screen glitchesFree weekend or temporary access
A free weekend can produce many simultaneous players who have not purchased the game. Check the event dates and access rules before treating the resulting CCU as evidence of sales. The subsequent retention pattern is more informative for ongoing demand than the event maximum.
Rank #3

- Ergonomic & Adjustable Design: Fight "text neck" and improve your posture. Designed for comfort, it offers an adjustable height (7.1in-8.5in) (1.4in adjustable range) and angle (5°-85°) Please note: cell phone stand is only 9 inches tall—the length of a standard pencil
- Without blocking subtitles Perfect for office desk Tiktok Face Time Zoom video—this is the ultimate kitchen desk essential for phones! Perfect viewing experience while reducing neck back strain, A must-have for gamers streamers desk, and anyone who values both style and support!
- Sleek & Stable Design fits Otterbox Case: Say goodbye to bent cables, tangles, and tip-overs! LISEN’s stylish adjustable desk phone holder features a built-in charging hole and smart cable management, keeping your phone secure and your workspace clutter-free cool gadgets for men
- ANTI-SLIP DESIGN free hands: The under 10.00 items easy gadgets back and the bottom of this kitchen essentials for women are fully covered by anti-skid silicone, which LISEN stand up desk decor can provide maximum protection device from any scratches and slides
- Your Perfect Viewing Companion:If your product arrives damaged or breaks within 365 days, reach out to LISEN for a quick and hassle-free solution. Struggling with assembly, like tightening the screw? We’ve got your back! Your experience matters to us. (Product including: phone Holder stand*1, screw*1, hexagon screwdriver*1, specification*1)
Time of week and time of day
Players’ schedules create recurring peaks. Compare like-for-like periods: Friday evening with earlier Friday evenings, or a holiday with comparable holidays. A chart that covers only one weekend can exaggerate ordinary calendar effects.
External attention
Coverage, a broadcast, a creator video or a community event can produce a short burst. If you identify such an event, report the timing and label it as a possible explanation unless independent evidence establishes causation.
Compare games and periods on an equal basis
Comparisons become misleading when one side uses a peak and the other uses an average, or when the date windows and providers differ. Align every dimension you can.
PC Slower Than It Used to Be?
A free scan shows the junk files, broken settings and background clutter dragging Windows down - then fixes them in one click.Free scan · Windows 10 & 11Outdated Drivers Are Slowing You Down
One free scan finds every outdated or missing driver and matches the right update for your exact hardware.Free scan · exact hardware match| Dimension | Valid comparison | Common invalid comparison |
|---|---|---|
| Metric | Daily peak CCU against daily peak CCU | Current CCU against sales rank |
| Time span | Same calendar dates or equivalent weekday windows | One launch weekend against another game’s quiet month |
| Provider | The same chart site and collection method for both titles | Combining hourly observations with five-minute refreshes without disclosure |
| Typical level | Average or sustained range before and after an event | Comparing only the single highest point |
| Scope | Steam activity for both games | Steam data for one title and all-platform claims for the other |
For a spike-versus-trend judgment, compare the duration above baseline, the number of repeated peaks and the typical level after the event. For a sales discussion, compare a sales ranking only with other sales rankings and identify the ranking’s date and geography if the page supplies them.
Does Steam player count mean sales?
No. A concurrent-player chart does not report copies sold or revenue, and there is no reliable universal conversion from a peak to units. Players may own the game already, use a free weekend, share access through a household arrangement or play for very different lengths of time. A sale can also attract existing owners without creating an equivalent number of new purchases.
What Valve’s visibility documentation actually says
Valve’s Steamworks documentation explains that activity can influence store visibility:
“Are people buying and playing your game? This is a strong signal to Steam that there is interest in your game and that Steam should try showing it to more players.”
Recommended: PC Feels Slow? A Free Scan Shows What's Dragging Windows Down →Recommended: Update Every Outdated Driver on Your PC in One Scan - Free →Special offer. See more information about Outbyte and uninstall instructions. Please review EULA and Privacy policy.
The statement describes a signal used by Steam’s visibility system. It does not provide an external observer with a formula for inferring sales from a CCU line. The same documentation discusses purchases and play in the context of visibility, while wishlists, store traffic and conversion are generally not direct visibility factors, subject to the qualifications in Valve’s Visibility on Steam documentation.
Rank #4

- Easy Installation: Our gaming lights have been designed to enhance your entertainment experience. Simply position the led light bar next to your TV or game console to create a game room environment with ease. They come with USB power and a 60 inch cord for direct mounting and mobility
- Audio Syncing & Extensive Mode: The built-in high-sensitivity music sensor allows you to sync the TV led lights to your favorite music. Lights react and move to the beat of music, film and game audio, creating an incredible immersive sound and light experience – and all without the need for an additional hub. You can choose from 64+ patterns, including strobe, illusion, jump, energy, gradient, running, chasing, fluttering mode etc. Each mode can be applied to different scenes
- 64+ Chasing IC+RGB & W Effect: The independent control design of IC+RGB and white all-in-one multifunctional rgbw led bar lights monitor backlight allows you to easily switch the led lights for desk between IC+RGB and white to enjoy a variety of lighting effects, you can choose white lighting mode with high brightness for better illumination when working, etc. Choose IC+RGB lighting mode when you need to create an entertaining atmosphere for the light show, 16 million colours of Color changing rgb light bar let you dance to the beat and create a dynamic party atmosphere
- Dynamic and Dimmable Lights: 1%-full brightness free brightness adjustment gives you the flexibility to adjust dimmable led light bar for room decorations or a variety of occasions
- USB Powered: USB light bars for room can be powered by powernank, usb charger, TV, Monitor, laptop PC mainframe, making behind TV led lighting bar easy to install in any location.TV led lights are powered by the TV usb interface / PC mainframe, can be turned on/off synchronously with TV / PC
Use the right evidence for a sales claim
To claim that sales increased, use disclosed sales figures, a clearly defined sales report or a sales ranking with its limitations. You may say that a CCU increase indicates more simultaneous play on Steam, or that it coincided with a promotion. You may not present the CCU value as units sold or revenue.
How to read a sales ranking without overclaiming
A sales ranking is a relative position, not an absolute total. A move from rank 40 to rank 10 means the game’s position among the products included in that ranking changed; it does not reveal how many copies were sold or whether the market as a whole expanded.
Read the ranking context
- Record the date and the exact ranking view.
- Check whether the list is global or limited to a country or storefront region.
- Note whether it covers all products, new releases, discounted products or another subset.
- Compare the same ranking type across periods.
- Keep the ranking separate from concurrent-player charts in both tables and prose.
A ranking rise and a CCU rise can coincide during a discount, but the two signals still measure different things. Report the overlap as evidence of simultaneous movement, not as a conversion rate.
The Tool Desk
Outbyte PC Repair FREERepair Windows errors before they cause bigger problemsFix Now →Outbyte Driver Updater FREEFix the driver behind crashes, sound loss and screen glitchesFind Drivers →Keep platform-wide context in perspective
In its 2023 annual summary, Valve reported that Steam surpassed 33 million concurrent users for the first time: Steam Annual Summary: 2023. That is a platform-wide concurrent-user figure, not a per-game count, sales total or proof of a trend for any particular title. It can provide scale for the platform, but it cannot explain why one game’s chart moved.
Common chart-reading mistakes and fixes
Calling the maximum “average players”
Problem: The article labels the highest point as the game’s normal audience.
Fix: Name it as a peak and provide the surrounding range or an average if the chart supports one.
Mixing provider data silently
Problem: A line switches from one collector to another, making a method change look like a player change.
Fix: Keep one provider for the comparison or mark the boundary and explain each cadence.
Using a short window for a long-term claim
Problem: A launch weekend is used to claim monthly growth.
Fix: Expand the window and inspect post-event observations.
Quick wins for a faster PC:
Fix the driver behind crashes, sound loss and screen glitchesFind Drivers →Repair Windows errors before they cause bigger problemsFix Now →Assuming a discount caused every increase
Problem: A sale date is treated as proof of causation.
Fix: Check update, launch, free-access and calendar effects, then write “coincided with” unless stronger evidence exists.
Best Value

- Compatible with Wide Screens - To ensure compatibility with the dual monitor mount, your each monitor must meet three conditions at the same time: First, computer screens size range: 13 to 32 inches. Second, screen weight range: 4.4 to 19.8 lbs. Third, the back of the monitor screen must have VESA mounting holes with a pitch of 75x75mm or 100x100mm.
- Regarding the compatibility with desks - Your desk must meet three conditions at the same time: First, desk material: Only wooden desks are recommended, plastic or glass desks cannot be used. Second, desk thickness range: 0.59" - 3.54". Third, the bottom of the desk should not have any cross beams or panels, as this will interfere with installation. We recommend carefully checking that your desk and monitors meets all above conditions before purchasing.
- Dual C-Clamp Hold - Worried your dual monitors might wobble or slip? Our upgraded base uses a larger platform plus a dual C-clamp structure to lock the dual monitor arm firmly to your desk. Each arm safely keeps your screens steady while you type, click and game—no shaking, no sliding, just a clean and secure setup you can trust every day. It also provides Grommet Mounting installation choice, both options ensure stable and secure fixation for your 0.59" - 3.54" desk.
- Full-Motion Adjustment For Comfortable View - Pull the screen closer when you’re deep in a spreadsheet, push it back to watch videos, or rotate to portrait for coding — moving everything smoothly with just one hand. The monitor stand offers +85°/-50° tilt, ±90° swivel and 360° rotation. Raise your monitor up to 15.75″ to support a healthy sitting posture. Whether you’re working from home, gaming through the night, or switching between video calls and documents, getting the screens to your natural line of sight helps relieve neck, shoulder and back strain so you can stay focused longer with less fatigue.
- Keep Your Desk Organized: By lifting both screens off the desktop, this dual monitor stand opens up valuable space for your keyboard, notebook, docking station or a simple, clutter-free work area. Built-in cable management guides wires along the arms, keeping cords out of sight and out of the way. Enjoy a tidy, modern workstation that looks as good as it feels to use.
Turning CCU into sales
Problem: A peak is multiplied by an invented player-to-buyer factor.
Fix: Remove the estimate and seek a separate sales source.
Ignoring non-Steam activity
Problem: Steam observations are described as the game’s total audience.
Fix: Limit the claim to Steam and identify other platforms as unmeasured.
Treating a ranking position as a unit count
Problem: A rank is presented as if it were a percentage or number of copies.
Fix: Describe only the relative movement and the ranking’s scope.
Worked interpretation patterns
A one-day launch peak
Suppose a new game reaches its highest CCU on release day, then returns near its pre-release test level. The defensible conclusion is that launch attention produced a concentrated peak. To call it a trend, you would need evidence that typical activity stayed materially higher across later comparable periods.
A discount with repeated weekend highs
If a discount overlaps with a rise and the game records higher levels on several subsequent weekends, the pattern is consistent with sustained interest during that window. It still does not identify how many purchases came from the discount, because owners returning to play and calendar effects remain possible explanations.
An update-day burst with a provider mismatch
If SteamDB shows a sharp maximum on patch day while an hourly Steam Charts series shows a lower value, first check polling cadence and timestamps. Describe the values as observations from different collectors rather than choosing the larger number as the “real” peak.
A higher sales rank but flat CCU
A sales-rank improvement alongside flat concurrent activity may indicate more purchases without longer sessions, purchases by people who have not yet played, or movement among competing products. The public charts cannot distinguish those explanations. Report the two signals separately.
Quick Recap
Publication checklist
- Have you named the metric: current CCU, peak, average, historical series or sales rank?
- Have you stated the provider, dates and sampling method?
- Did you compare equivalent periods and avoid mixing platforms?
- Did you mark launches, updates, discounts, free access and calendar effects?
- Does the evidence show persistence and repeated movement, or only one maximum?
- Have you avoided converting players or rank into sales and revenue?
- Are causal statements limited to what the dates and sources establish?
- Are Steam-specific conclusions labeled as Steam-specific?
Product prices and availability are accurate as of the date/time indicated and are subject to change. Any price and availability information displayed on Amazon at the time of purchase will apply.

